Overview
The Contextualization Quality Dashboard module provides a comprehensive solution for measuring, monitoring, and visualizing the contextualization quality of your data in Cognite Data Fusion (CDF). It consists of two main components:
- Contextualization Quality Metrics Function (external_id:
context_quality_handler) - Computes all quality metrics and saves them as a JSON file in CDF - Streamlit Dashboard (
context_quality_dashboard) - Visualizes the pre-computed metrics with interactive gauges, charts, and tables
This module helps data engineers and operations teams understand how well their data is contextualized across three key dimensions:
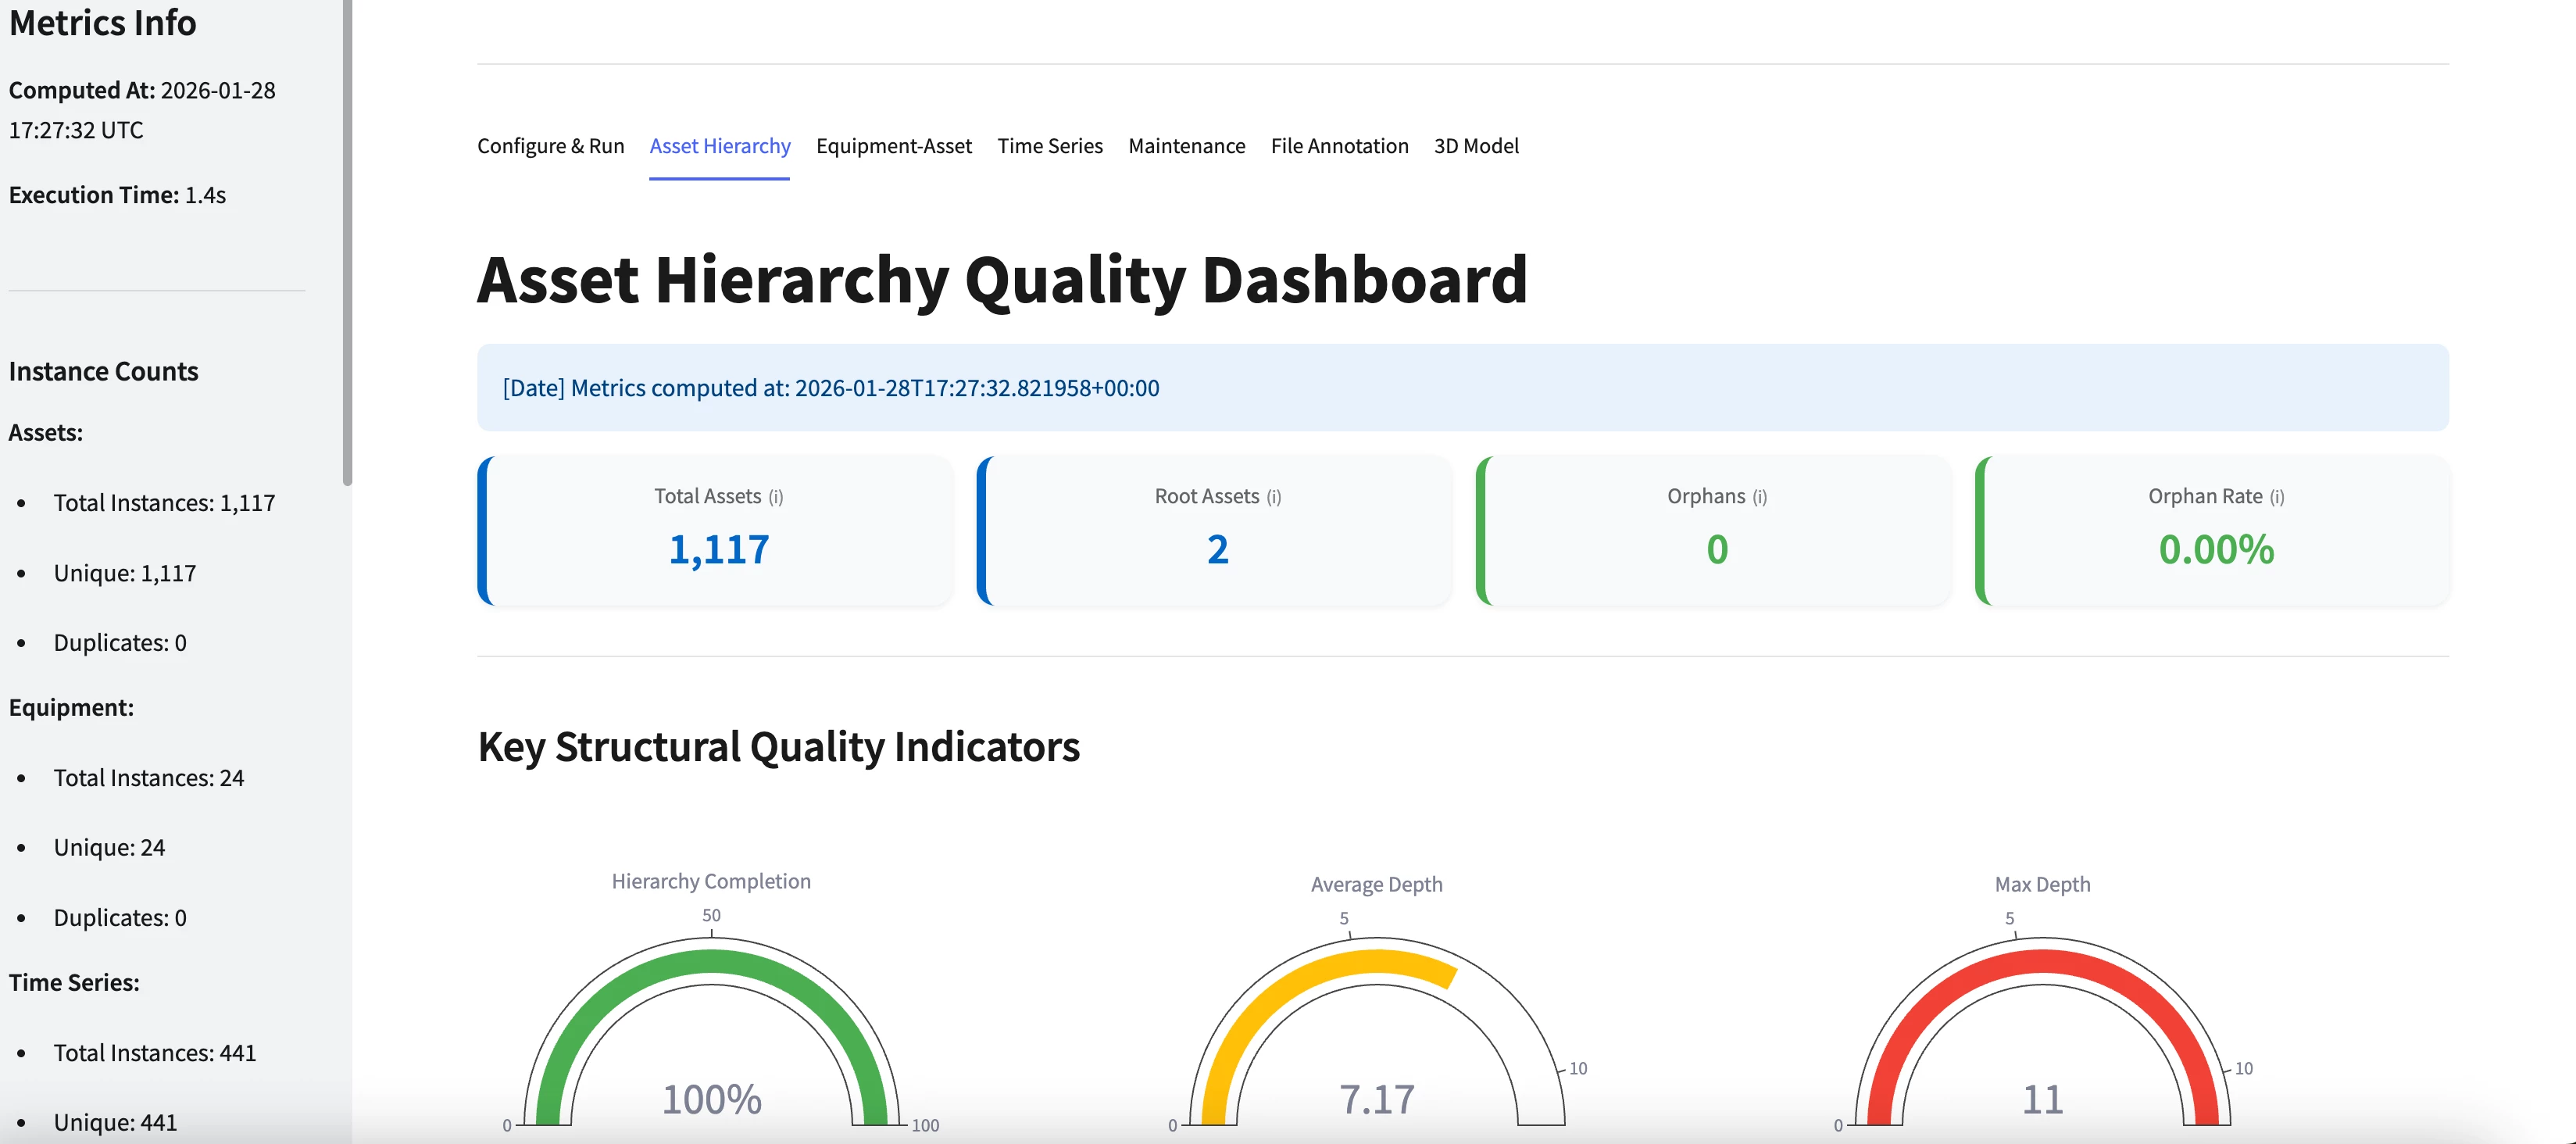
- Asset Hierarchy Quality - Structural integrity of the asset tree
- Equipment-Asset Relationships - Quality of equipment-to-asset mappings
- Time Series Contextualization - How well time series are linked to assets
Module Components
context_quality/
├── auth/ # Authentication configurations
├── data_sets/
│ └── context_quality_dashboard.DataSet.yaml # Dataset for storing function code and files
├── functions/
│ ├── context_quality_handler/
│ │ └── handler.py # Main Cognite Function code
│ └── context_quality.Function.yaml # Function configuration
├── streamlit/
│ ├── context_quality_dashboard/
│ │ ├── main.py # Streamlit dashboard code
│ │ └── requirements.txt # Python dependencies
│ └── context_quality_dashboard.Streamlit.yaml # Streamlit app configuration
├── module.toml # Module metadata
└── README.md # This file
Deployment
Prerequisites
Before you start, ensure you have:
- A Cognite Toolkit project set up locally
- Your project contains the standard
cdf.tomlfile - Valid authentication to your target CDF environment
Step 1: Enable External Libraries
Edit your project's cdf.toml and add:
[alpha_flags]
external-libraries = true
[library.cognite]
url = "https://github.com/cognitedata/library/releases/download/latest/packages.zip"
checksum = "sha256:795a1d303af6994cff10656057238e7634ebbe1cac1a5962a5c654038a88b078"This allows the Toolkit to retrieve official library packages.
📝 Note: Replacing the Default Library
By default, a Cognite Toolkit project contains a
[library.toolkit-data]section pointing tohttps://github.com/cognitedata/toolkit-data/.... This provides core modules like Quickstart, SourceSystem, Common, etc.These two library sections cannot coexist. To use this Deployment Pack, you must replace the
toolkit-datasection withlibrary.cognite:
Replace This With This [library.toolkit-data][library.cognite]github.com/cognitedata/toolkit-data/...github.com/cognitedata/library/...The
library.cognitepackage includes all Deployment Packs developed by the Value Delivery Accelerator team (RMDM, RCA agents, Context Quality Dashboard, etc.).
⚠️ Checksum Warning
When running
cdf modules add, you may see a warning like:WARNING [HIGH]: The provided checksum sha256:... does not match downloaded file hash sha256:...
Please verify the checksum with the source and update cdf.toml if needed.
This may indicate that the package content has changed.This is expected behavior. The checksum in this documentation may be outdated because it gets updated with every release. The package will still download successfully despite the warning.
To resolve the warning: Copy the new checksum value shown in the warning message and update your
cdf.tomlwith it. For example, if the warning showssha256:da2b33d60c66700f..., update your config to:[library.cognite]
url = "https://github.com/cognitedata/library/releases/download/latest/packages.zip"
checksum = "sha256:da2b33d60c66700f..."
Step 2 (Optional but Recommended): Enable Usage Tracking
To help improve the Deployment Pack:
cdf collect opt-inStep 3: Add the Module
Run:
cdf modules init .⚠️ Disclaimer: This command will overwrite existing modules. Commit changes before running, or use a fresh directory.
Step 4: Select the Dashboards Package
From the menu, select:
Dashboards: Streamlit dashboards and visualization modules
Then select Contextualization Quality Dashboard.
Step 5: Verify Folder Structure
After installation, your project should contain:
modules/
└── dashboards/
└── context_quality/
Step 6: Deploy to CDF
Build and deploy:
cdf buildcdf deploy --dry-runcdf deployConfiguration
Default Data Model View
By default, the function queries the Cognite Core Data Model (CDM) views. The default configuration is set in lines 68-93 of handler.py:
DEFAULT_CONFIG = {
"chunk_size": 500,
# View configurations - DEFAULT: Cognite Core Data Model (cdf_cdm)
"asset_view_space": "cdf_cdm",
"asset_view_external_id": "CogniteAsset",
"asset_view_version": "v1",
"ts_view_space": "cdf_cdm",
"ts_view_external_id": "CogniteTimeSeries",
"ts_view_version": "v1",
"equipment_view_space": "cdf_cdm",
"equipment_view_external_id": "CogniteEquipment",
"equipment_view_version": "v1",
# Processing limits
"max_timeseries": 150000,
"max_assets": 150000,
"max_equipment": 150000,
# Freshness settings
"freshness_days": 30,
# Historical gap analysis
"enable_historical_gaps": True,
"gap_sample_rate": 20,
"gap_threshold_days": 7,
"gap_lookback": "1000d-ago",
# ... more config
}Changing the Data Model View
If your project uses a custom data model instead of the CDM, modify lines 71-79 in handler.py:
# Example: Using a custom data model view
"asset_view_space": "your_custom_space",
"asset_view_external_id": "YourAssetView",
"asset_view_version": "v1",
"ts_view_space": "your_custom_space",
"ts_view_external_id": "YourTimeSeriesView",
"ts_view_version": "v1",
"equipment_view_space": "your_custom_space",
"equipment_view_external_id": "YourEquipmentView",
"equipment_view_version": "v1",Alternatively, you can pass configuration overrides when calling the function:
# Call the Contextualization Quality Metrics function
client.functions.call(
external_id="context_quality_handler",
data={
"asset_view_space": "my_space",
"asset_view_external_id": "MyAssetView",
"asset_view_version": "v1"
}
)Project-Specific Field Names
Different projects may use different property names for certain fields. Here are the key fields you may need to customize:
| Field | Default Property Name | Location to Modify |
|---|---|---|
| Asset Criticality | criticality | Line 402 in handler.py |
| Equipment Criticality | criticality | Line 444 in handler.py |
| Asset Type | type or assetClass | Line 414 in handler.py |
| Equipment Type | equipmentType | Line 440 in handler.py |
| Serial Number | serialNumber | Line 442 in handler.py |
| Manufacturer | manufacturer | Line 443 in handler.py |
Post-Deployment: Running the Function
⚠️ IMPORTANT: The Cognite Function MUST be executed at least once before launching the Streamlit dashboard. The dashboard reads pre-computed metrics from a JSON file that the function generates.
Run the Function
After deployment, trigger the function:
Option 1: Using the CDF UI
- Navigate to Functions in the CDF UI
- Find Contextualization Quality Metrics (external_id:
context_quality_handler) - Click Run or Call
Option 2: Using the SDK
from cognite.client import CogniteClient
client = CogniteClient()
# Run the Contextualization Quality Metrics function with default configuration
response = client.functions.call(
external_id="context_quality_handler",
data={}
)
print(response)Verify Function Execution (Optional)
💡 Tip: You can verify function execution directly in the CDF UI by navigating to Functions → Contextualization Quality Metrics → Logs/Calls to inspect the runtime logs and execution status.
The function will:
- Query all Time Series, Assets, and Equipment from the configured views
- Compute all quality metrics
- Save results to a Cognite File:
contextualization_quality_metrics
Alternative: Verify via SDK
file = client.files.retrieve(external_id="contextualization_quality_metrics")
print(f"File created: {file.name}, Size: {file.size} bytes")Launching the Dashboard
Once the function has run successfully, follow these steps to access the dashboard:
- Log in to CDF — Open Cognite Data Fusion and sign in to your project
- Navigate to Industrial Tools — In the left sidebar, click on Industrial Tools
- Open Custom Apps — Select Custom Apps from the menu
- Launch the Dashboard — Click on Contextualization Quality to open the app
⚠️ Note: If you see "Could not load metrics file", the Cognite Function has not been run yet. Return to the Run the Function section and execute it first.
The dashboard will load the pre-computed metrics and display three tabs:
- Asset Hierarchy Quality — Structural integrity of your asset tree
- Equipment-Asset Quality — Equipment-to-asset mapping quality
- Time Series Contextualization — How well time series are linked to assets
Scheduling the Function
For continuous monitoring, schedule the function to run periodically:
from cognite.client.data_classes import FunctionSchedule
# Schedule the Contextualization Quality Metrics function
client.functions.schedules.create(
FunctionSchedule(
name="Contextualization Quality Daily",
function_external_id="context_quality_handler",
cron_expression="0 6 * * *", # Daily at 6 AM
data={}
)
)Troubleshooting
Dashboard shows "Could not load metrics file"
Cause: The Cognite Function has not been run yet, or it failed.
Solution:
- Run the function manually (see above)
- Check function logs for errors
- Verify the file
contextualization_quality_metricsexists in CDF Files
Metrics show all zeros
Cause: The data model views are empty or misconfigured.
Solution:
- Verify your data exists in the configured views
- Check that the view space, external_id, and version match your data model
- Modify lines 71-79 in
handler.pyif using a custom data model
Function times out
Cause: Too much data to process within the 10-minute function limit.
Solution:
- Reduce processing limits in configuration:
{
"max_timeseries": 50000,
"max_assets": 50000,
"max_equipment": 50000
} - Disable historical gap analysis:
"enable_historical_gaps": False
Metrics Reference
The Contextualization Quality module computes 25+ metrics across three categories. Below is a detailed explanation of each metric, including formulas and interpretation guidelines.
1. Asset Hierarchy Metrics
These metrics assess the structural quality and completeness of your asset hierarchy.
1.1 Hierarchy Completion Rate
What it measures: The percentage of non-root assets that have a valid parent link.
Formula:
Hierarchy Completion Rate (%) = (Assets with Parent / Non-Root Assets) × 100
Where:
Non-Root Assets = Total Assets - Root Assets
Interpretation:
- 🟢 ≥ 98%: Excellent - Nearly complete hierarchy
- 🟡 95-98%: Warning - Some missing links
- 🔴 < 95%: Critical - Hierarchy has gaps
1.2 Orphan Count & Rate
What it measures: Orphans are assets that have no parent AND no children - they are completely disconnected from the hierarchy.
Formula:
Orphan Rate (%) = (Orphan Count / Total Assets) × 100
Where:
Orphan = Asset where parent == NULL AND children_count == 0
Interpretation:
- 🟢 0 orphans: Perfect - All assets are connected
- 🟡 1-5 orphans: Warning - Minor disconnected assets
- 🔴 > 5 orphans: Critical - Significant hierarchy issues
1.3 Depth Statistics
Average Depth:
Average Depth = Σ(Depth of each asset) / Total Assets
Where:
Depth = Number of levels from root to the asset (root = 0)
Max Depth: The deepest level in the hierarchy.
Interpretation:
- 🟢 Max Depth ≤ 6: Good - Reasonable hierarchy depth
- 🟡 Max Depth 7-8: Warning - Deep hierarchy
- 🔴 Max Depth > 8: Critical - Excessively deep hierarchy
1.4 Breadth Statistics
Average Children per Parent:
Average Children = Σ(Children count per parent) / Number of parents
Standard Deviation of Children:
Std Dev = √(Σ(children_count - avg_children)² / n)
A high standard deviation indicates an uneven distribution (some parents have many children, others have few).
2. Equipment-Asset Relationship Metrics
These metrics measure the quality of equipment-to-asset mappings.
2.1 Equipment Association Rate
What it measures: The percentage of equipment items that are linked to an asset.
Formula:
Equipment Association Rate (%) = (Equipment with Asset Link / Total Equipment) × 100
Interpretation:
- 🟢 ≥ 90%: Excellent - Nearly all equipment is linked
- 🟡 70-90%: Warning - Some unlinked equipment
- 🔴 < 70%: Critical - Many equipment items lack asset links
2.2 Asset Equipment Coverage
What it measures: The percentage of assets that have at least one equipment linked to them.
Formula:
Asset Equipment Coverage (%) = (Assets with Equipment / Total Assets) × 100
2.3 Serial Number Completeness
What it measures: The percentage of equipment items that have the serialNumber property populated.
Formula:
Serial Number Completeness (%) = (Equipment with Serial Number / Total Equipment) × 100
Interpretation:
- 🟢 ≥ 90%: Excellent - Good equipment traceability
- 🟡 70-90%: Warning - Some missing serial numbers
- 🔴 < 70%: Critical - Poor equipment documentation
2.4 Manufacturer Completeness
What it measures: The percentage of equipment items that have the manufacturer property populated.
Formula:
Manufacturer Completeness (%) = (Equipment with Manufacturer / Total Equipment) × 100
2.5 Type Consistency
What it measures: The percentage of equipment where the equipment type is consistent with the linked asset's type. Uses predefined mappings (e.g., a pump equipment should link to a pump asset).
Formula:
Type Consistency Rate (%) = (Consistent Relationships / Total Equipment) × 100
📝 Note: Type mappings are defined in lines 96-101 of
handler.py. Modify these mappings to match your project's type definitions:TYPE_MAPPINGS = {
"iso14224_va_di_diaphragm": ["VALVE", "CONTROL_VALVE"],
"iso14224_pu_centrifugal_pump": ["PUMP", "PUMPING_EQUIPMENT"],
# Add your custom mappings here
}
2.6 Critical Equipment Contextualization
What it measures: The percentage of critical equipment that is linked to an asset.
Formula:
Critical Equipment Contextualization (%) = (Critical Equipment Linked / Total Critical Equipment) × 100
⚠️ Note: Similar to critical assets, if your project uses a different field name for equipment criticality, modify line 444 in
handler.py:criticality=props.get("criticality"), # Change "criticality" to your field name
3. Time Series Contextualization Metrics
These metrics measure how well time series data is linked to assets and the quality of the time series metadata.
3.1 TS to Asset Contextualization Rate
What it measures: The percentage of time series that are linked to at least one asset.
⚠️ Why this is the primary metric: An orphaned time series (not linked to any asset) cannot be associated with equipment, location, or business context. This makes the data difficult to discover and use. Every time series should be contextualized.
Formula:
TS to Asset Rate (%) = (Time Series with Asset Link / Total Time Series) × 100
Interpretation:
- 🟢 ≥ 95%: Excellent - Nearly all TS are contextualized
- 🟡 90-95%: Warning - Some orphaned time series exist
- 🔴 < 90%: Critical - Many time series lack asset context
3.2 Asset Monitoring Coverage
What it measures: The percentage of assets that have at least one time series linked to them.
Note: It is acceptable for some assets (e.g., structural assets, buildings, organizational units) to not have time series. This metric helps identify assets that could benefit from monitoring data.
Formula:
Asset Monitoring Coverage (%) = (Assets with Time Series / Total Assets) × 100
Interpretation:
- 🟢 > 80%: Good - Most assets have monitoring data
- 🟡 70-80%: Warning - Some assets lack time series
- 🔴 < 70%: Critical - Many assets are unmonitored
3.3 Critical Asset Coverage
What it measures: The percentage of critical assets that have time series linked. Critical assets are those with criticality = "critical" in their properties.
Formula:
Critical Asset Coverage (%) = (Critical Assets with TS / Total Critical Assets) × 100
Interpretation:
- 🟢 100%: Perfect - All critical assets are monitored
- 🟡 ≥ 95%: Warning - Nearly all critical assets covered
- 🔴 < 95%: Critical - Critical assets are unmonitored
⚠️ Note: If your project uses a different property name for criticality (e.g.,
priority,importance,criticalityLevel), you must modify line 402 inhandler.py:if props.get("criticality") == "critical": # Change "criticality" to your field name
3.4 Source Unit Completeness
What it measures: The percentage of time series that have the sourceUnit property populated. The source unit represents the original unit of measurement from the data source (e.g., "°C", "bar", "rpm").
Formula:
Source Unit Completeness (%) = (TS with sourceUnit / Total TS) × 100
Interpretation:
- 🟢 > 95%: Excellent - Nearly all TS have unit information
- 🟡 90-95%: Good - Most TS have units
- 🔴 < 90%: Warning - Many TS lack unit metadata
3.5 Target Unit Completeness (Standardized Unit)
What it measures: The percentage of time series with a standardized unit property. This represents the converted/normalized unit after any unit transformations.
Formula:
Target Unit Completeness (%) = (TS with unit / Total TS) × 100
3.6 Unit Mapping Rate
What it measures: When both sourceUnit and unit are present, this metric tracks how many have matching values (indicating no conversion was needed or conversion is complete).
Formula:
Unit Mapping Rate (%) = (TS where unit == sourceUnit / TS with both units) × 100
3.7 Data Freshness
What it measures: The percentage of time series that have been updated within the last N days (default: 30 days).
Formula:
Data Freshness (%) = (TS updated within N days / Total TS) × 100
Interpretation:
- 🟢 ≥ 90%: Excellent - Data is current
- 🟡 70-90%: Warning - Some stale data
- 🔴 < 70%: Critical - Significant stale data
3.8 Average Time Since Last TS Update
What it measures: The average time difference between "now" and the lastUpdatedTime of time series.
⚠️ Important: This metric tracks metadata updates (when the time series definition was last modified), NOT when the latest datapoint was ingested. For actual data freshness, see the "Data Freshness" metric which checks if TS have been updated within the last N days.
Formula:
Avg Time Since Last TS Update (hours) = Σ(Now - lastUpdatedTime) / Count of valid TS
3.9 Historical Data Completeness
What it measures: The percentage of the time span that contains actual data (vs gaps). A gap is defined as a period longer than the threshold (default: 7 days) without any datapoints.
Formula:
Historical Data Completeness (%) = ((Total Time Span - Total Gap Duration) / Total Time Span) × 100
Example: If a time series spans 365 days but has a 30-day gap:
Completeness = (365 - 30) / 365 × 100 = 91.8%
Interpretation:
- 🟢 ≥ 95%: Excellent - Minimal data gaps
- 🟡 85-95%: Warning - Some significant gaps
- 🔴 < 85%: Critical - Major data gaps exist
Support
For troubleshooting or deployment issues:
- Refer to the Cognite Documentation
- Contact your Cognite support team
- Join the Slack channel #topic-deployment-packs for community support and discussions
Check the
documentation
Ask the
Community
Take a look
at
Academy
Cognite
Status
Page
Contact
Cognite Support