In my endeavor to make a percentwise threshold in Charts: I.e. how many percent of the last week was a time series above a certain value, I stumbled on what I think is a bug.
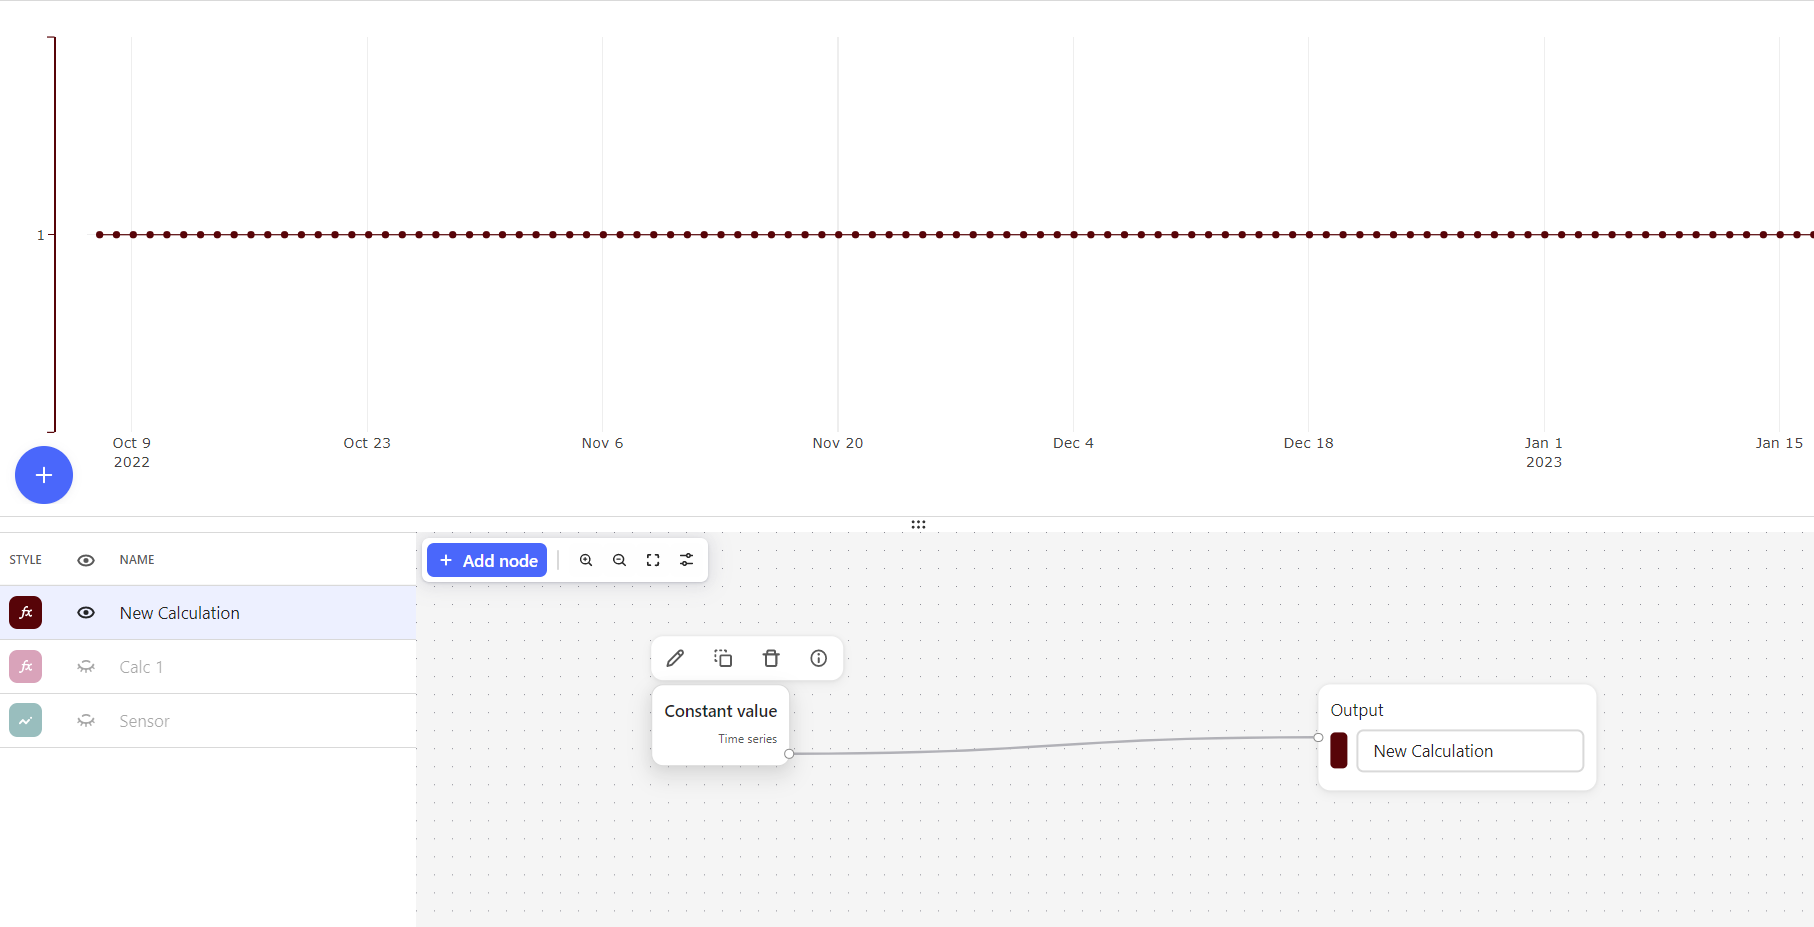
I need to divide the time the timeseries is above a threshold by the total duration of the time window. I therefore tried the “constant value”-function, and set it to one.
The default granularity is then at 7 days. I can change the granularity to 1 day as in the screenshot below:
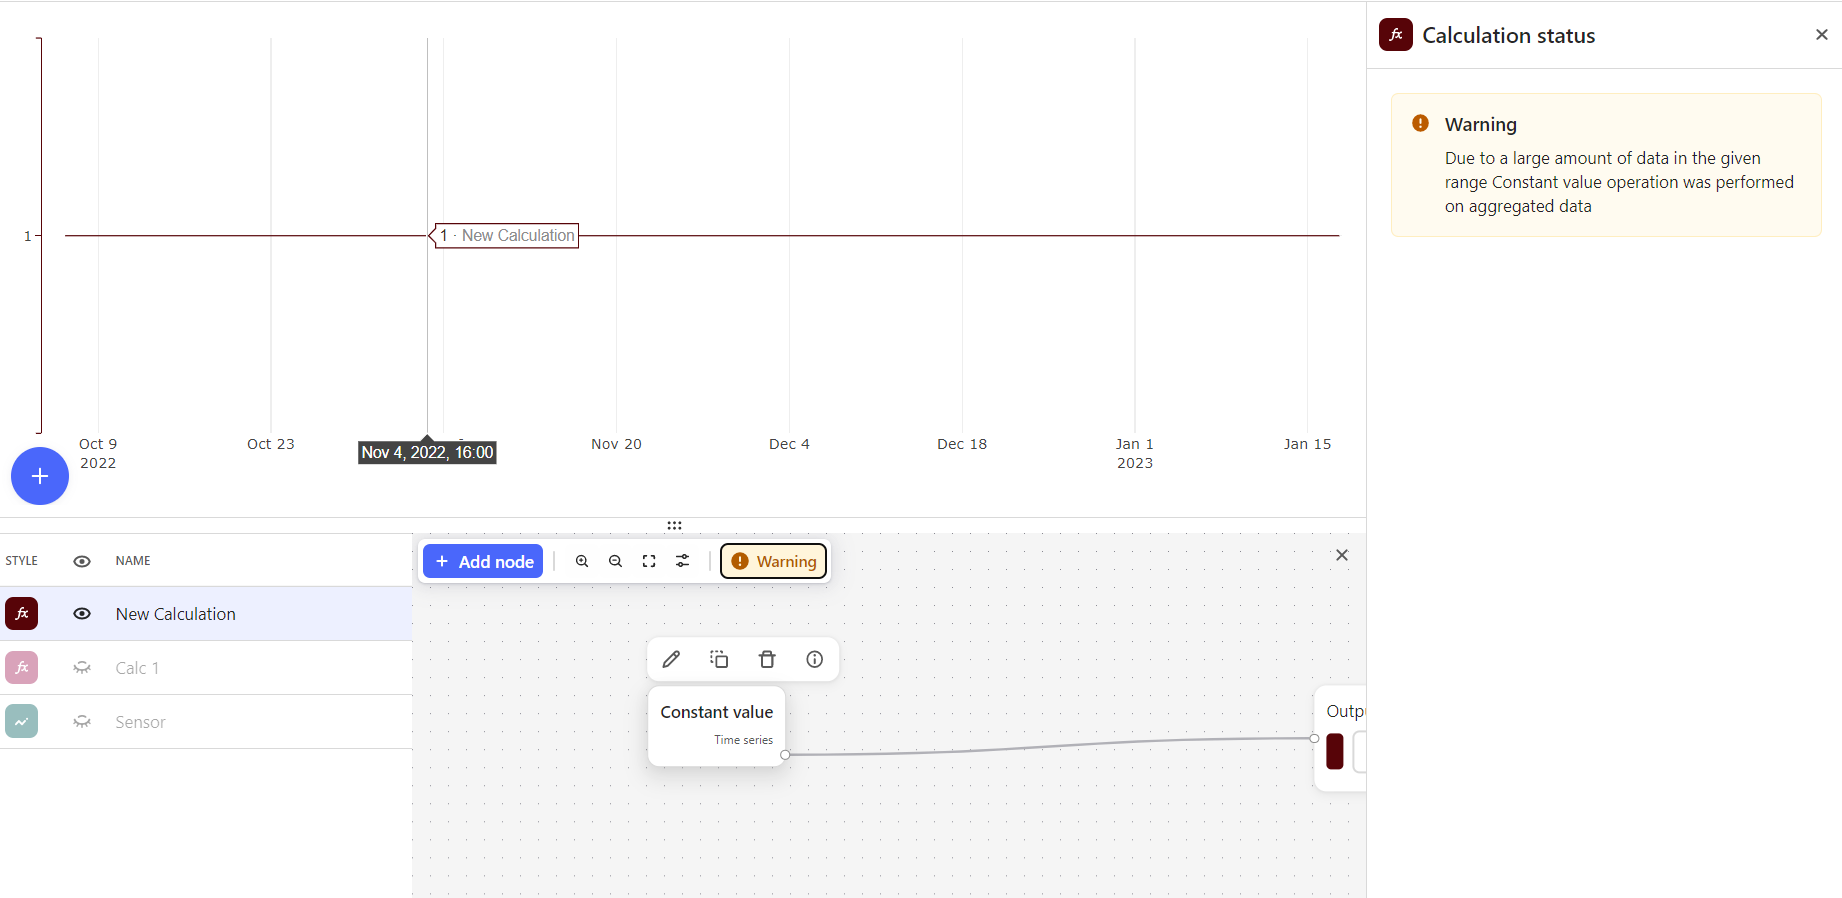
However, when I change the granularity below this. Eg. 1 hour, I get the following warning:
Ideally I want it to 1m or something like that, so that I have sufficient granularity to measure percentage above threshold over the course of a day.
Any suggestions as to how I can fix this, or an alternative way to reach my goal?
Thank you
Best answer by Eric Stein-Beldring
Hi Simen,
The Warning you receive when using the Constant value function (Function → Signal generator → Constant value), rather than the Constant node, is because it’s being treated like any other function and calculation output – meaning, it’s subject to the 100k data point limit. Therefore, when your time period in view is large enough and/or the granularity you select is low enough, the calculation result will automatically be downsampled.
However, since the value of the constant is always the same value – in most cases – you should be able to ignore that warning. It’s actually best to choose a lower granularity and rely on the automatic data alignment built into the product to resample the data to the relevant granularity based on the other calculations you’ll be performing. So long as you have at least two data points at the start and end of the range in view on the plot, everything in between will be resampled to your constant value of choice. Note: Due to the nature of how our automatic data alignment algorithm handles reindexing, subsequent calculations using this output may not produce values before/after the first/last points (see my comment here for more details).
To that end, it might be better to use the Constant node, as opposed to the Constant value function, since we have some built-in logic to treat these nodes differently (i.e. don’t enforce the downsampling). If you use the Constant node with the Threshold function (Function → Operators → Threshold) to detect if and when a time series crosses a given value, the output will automatically resample at the proper granularity (so long as the time series has <100k data points for the range in view).
From there, you can use the Integration function (Function → Operators → Integration) at your time granularity of interest (e.g. 1m) and divide that result by a Constant of the total # of minutes in view and multiply by 100. The final result of this calculation should give you the percentage you’re interested in.
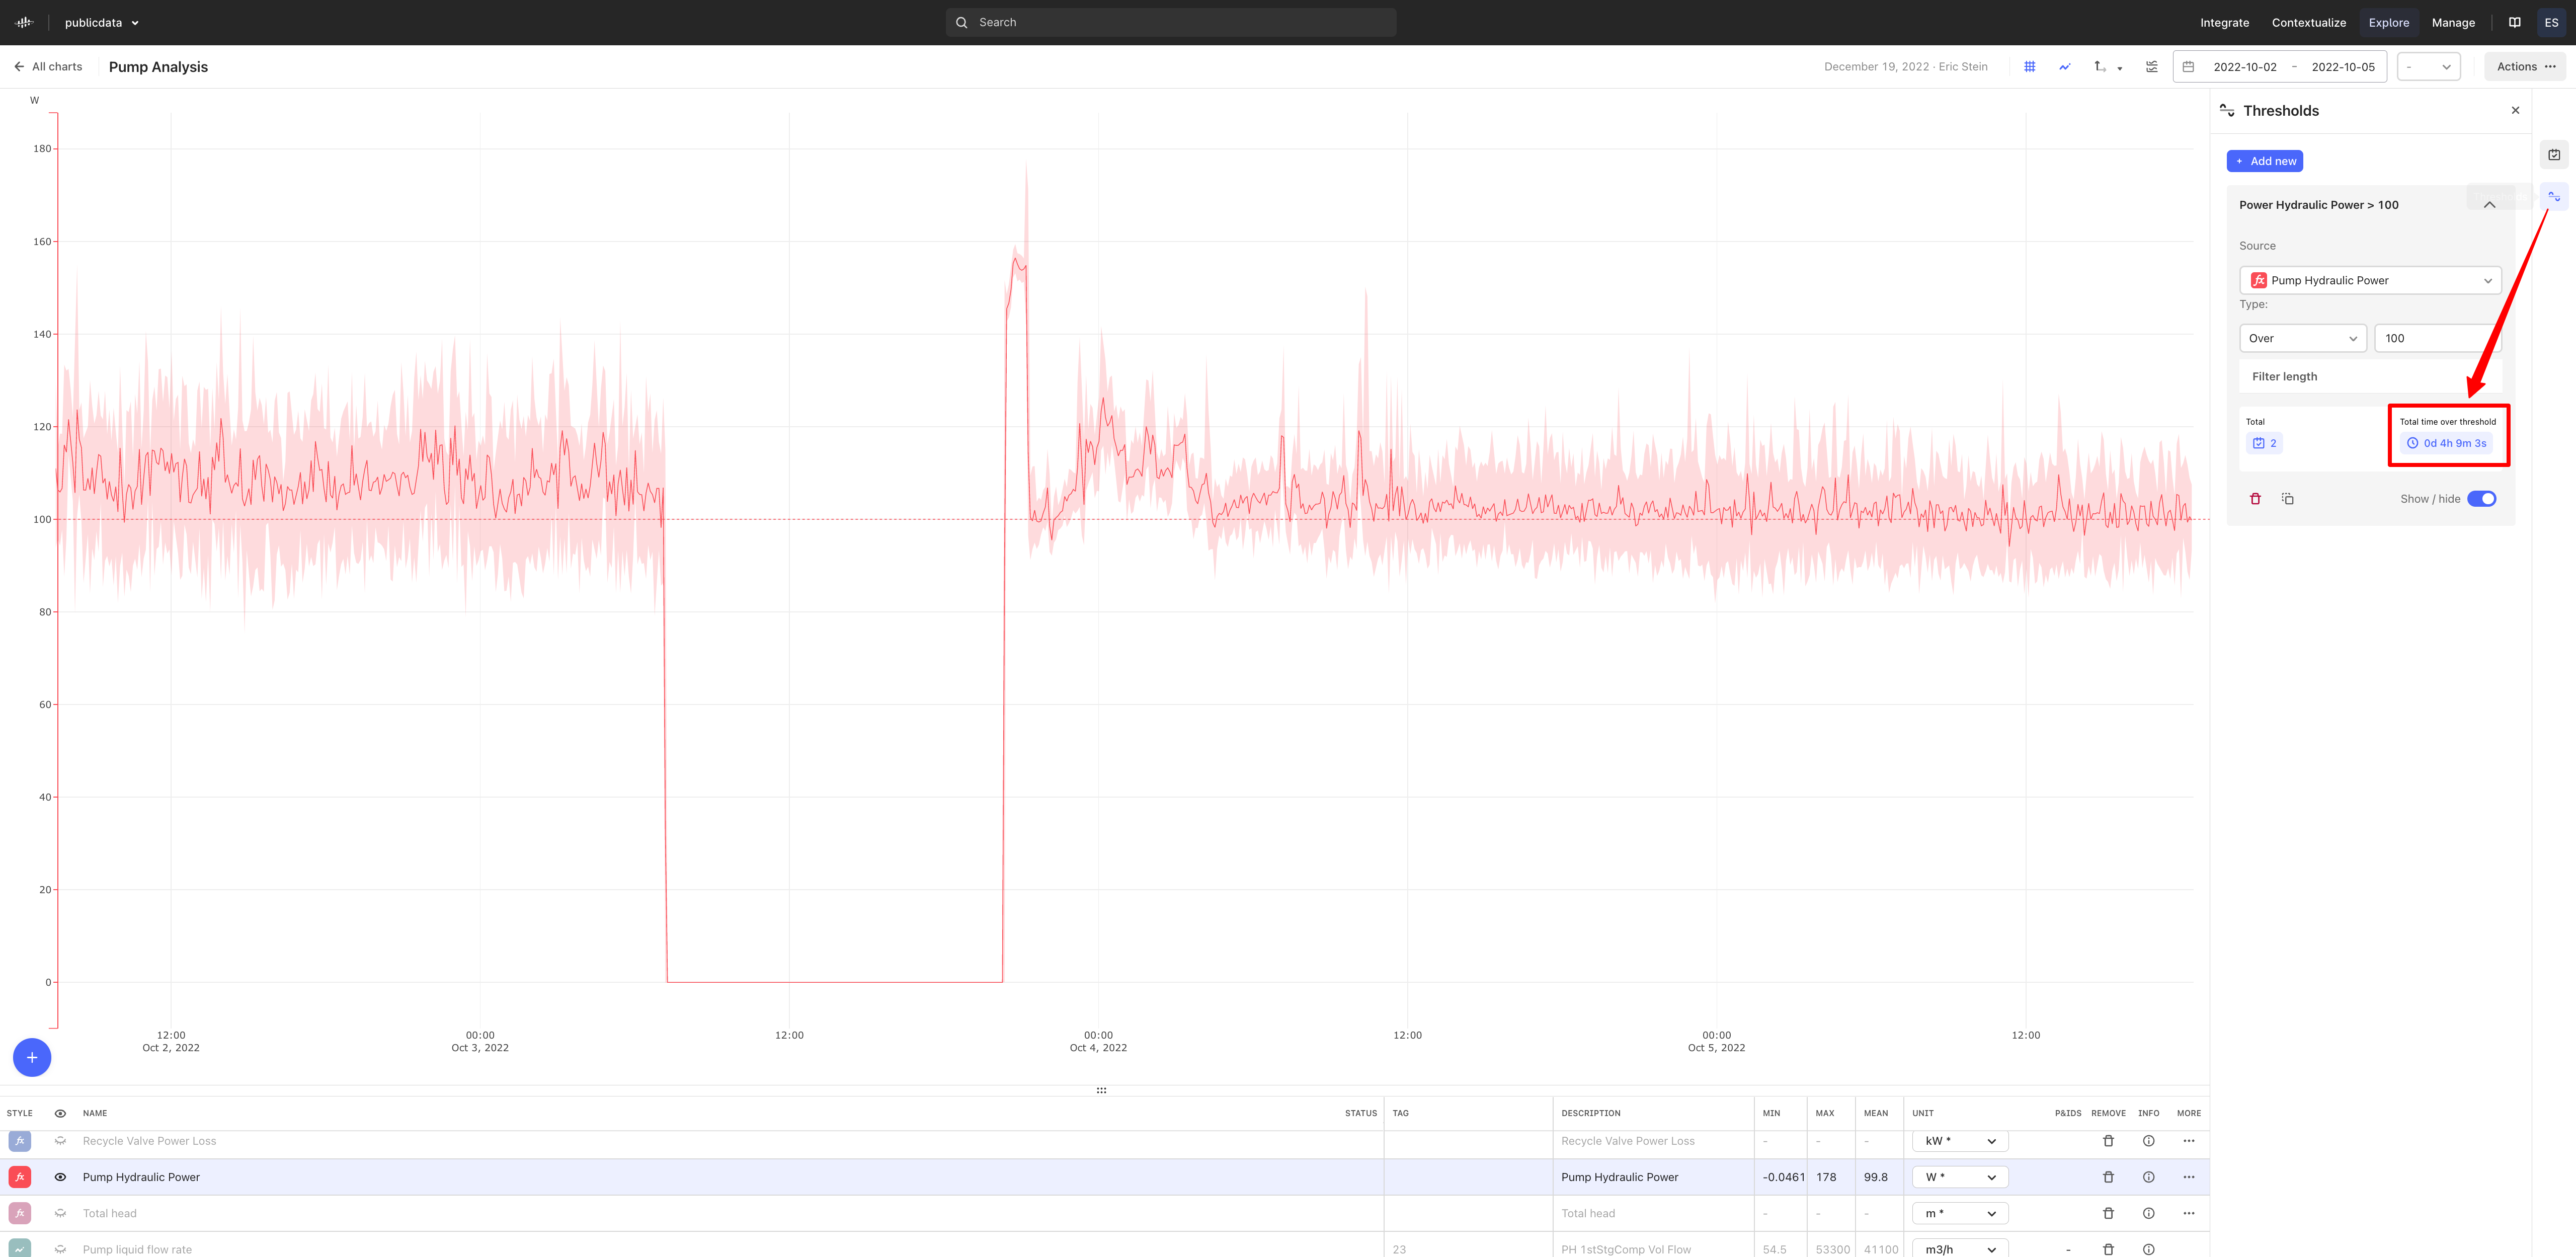
The built-in “Thresholds” feature (along the right-hand sidebar) could also be useful here:
It is possible to use the no-code calculations like a calculator (i.e. all constants, no time series) if you want to divide this time range by the total to get the result as a % of total time. Note: The 100k data point limit also applies for this feature.
The Warning you receive when using the Constant value function (Function → Signal generator → Constant value), rather than the Constant node, is because it’s being treated like any other function and calculation output – meaning, it’s subject to the 100k data point limit. Therefore, when your time period in view is large enough and/or the granularity you select is low enough, the calculation result will automatically be downsampled.
However, since the value of the constant is always the same value – in most cases – you should be able to ignore that warning. It’s actually best to choose a lower granularity and rely on the automatic data alignment built into the product to resample the data to the relevant granularity based on the other calculations you’ll be performing. So long as you have at least two data points at the start and end of the range in view on the plot, everything in between will be resampled to your constant value of choice. Note: Due to the nature of how our automatic data alignment algorithm handles reindexing, subsequent calculations using this output may not produce values before/after the first/last points (see my comment here for more details).
To that end, it might be better to use the Constant node, as opposed to the Constant value function, since we have some built-in logic to treat these nodes differently (i.e. don’t enforce the downsampling). If you use the Constant node with the Threshold function (Function → Operators → Threshold) to detect if and when a time series crosses a given value, the output will automatically resample at the proper granularity (so long as the time series has <100k data points for the range in view).
From there, you can use the Integration function (Function → Operators → Integration) at your time granularity of interest (e.g. 1m) and divide that result by a Constant of the total # of minutes in view and multiply by 100. The final result of this calculation should give you the percentage you’re interested in.
The built-in “Thresholds” feature (along the right-hand sidebar) could also be useful here:
It is possible to use the no-code calculations like a calculator (i.e. all constants, no time series) if you want to divide this time range by the total to get the result as a % of total time. Note: The 100k data point limit also applies for this feature.
Update: I investigated with @simenri further and we discovered that there is in fact a bug where the Constant value function is triggering the downsampling warning even when it's producing well below 100k points.
As a workaround until this bug is fixed, it is best to use either the Line function (with a slope = 0 and an intercept = to your constant of choice) and/or the Constant node in your calculations.


 Check the
documentation
Check the
documentation Ask the
Community
Ask the
Community Take a look
at
Academy
Take a look
at
Academy Cognite
Status
Page
Cognite
Status
Page Contact
Cognite Support
Contact
Cognite Support