Charts: I have a feature request. What do I do?


Userlevel 5

Have a feature request or idea for a new and improved functionality?

Then we want to hear all about it! We’re constantly working to improve the Charts product experience.

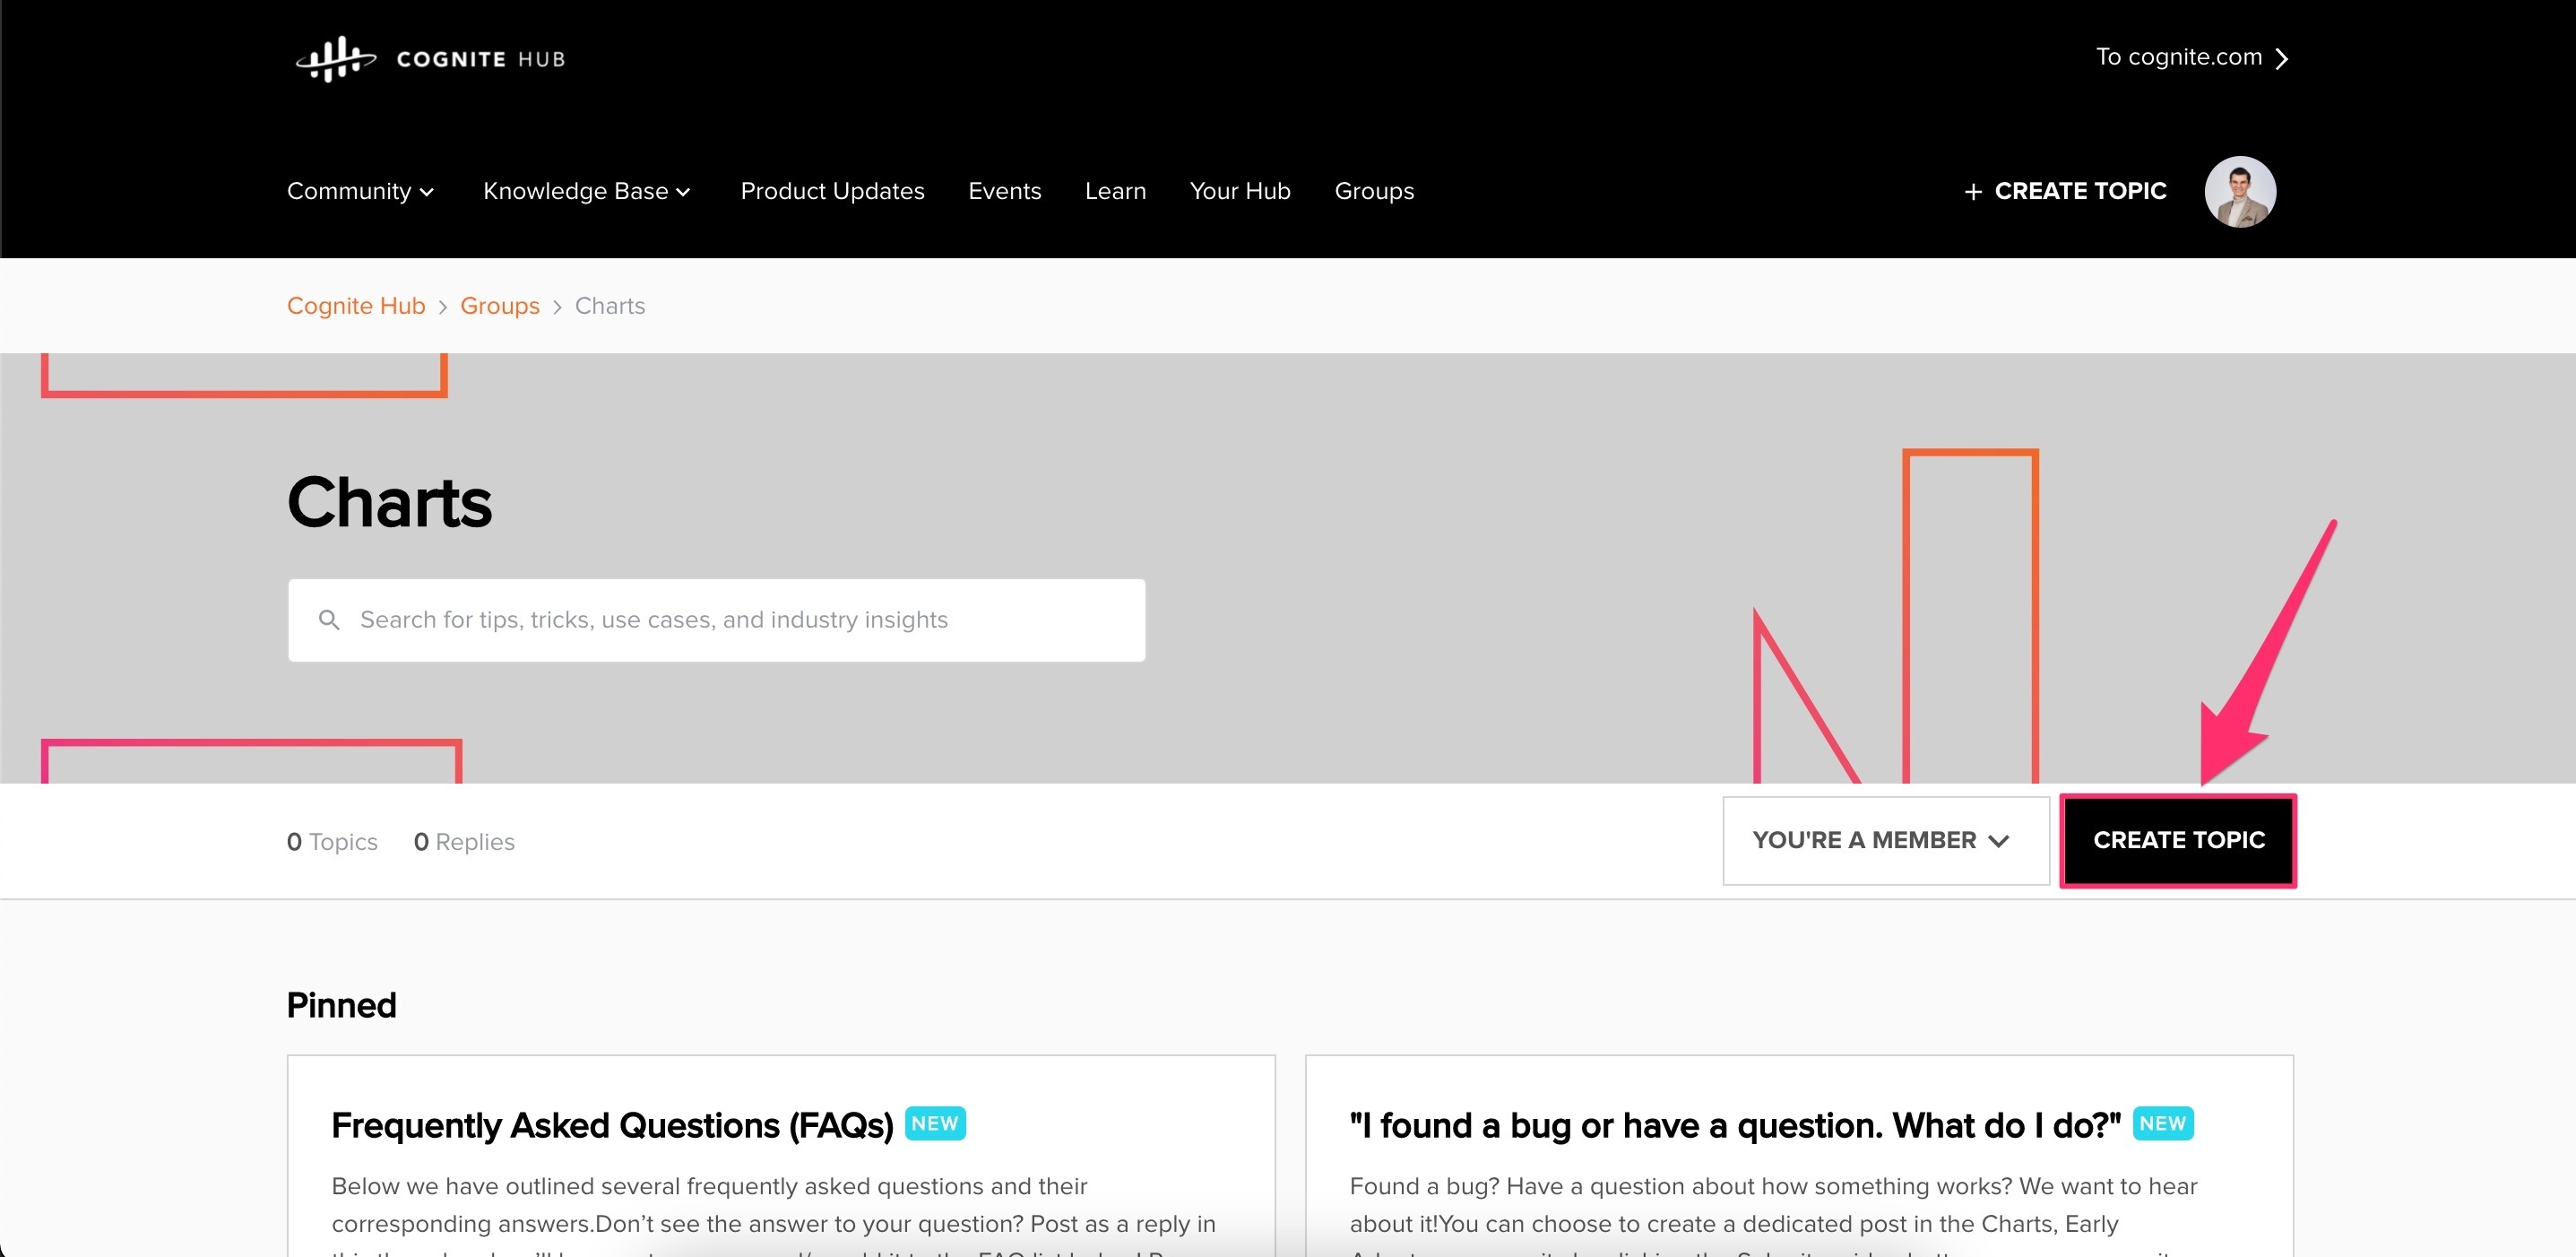
You can choose to either create a dedicated post (topic) in the Charts group by clicking the Create topic button OR simply post a reply below in this thread. Remember to say whether your feature request is Nice to haveImportant, or Critical to you and why. Screenshots, sketches, or explanatory videos are also encouraged.


35 replies

Userlevel 6
Badge

Hello, @Peter Quinn! Thank you for sharing this fantastic product idea. I would kindly request you to submit it in our Product Ideas section. This will allow other community members to upvote and support your idea. The level of traction and upvotes can potentially influence our product team's decisions on when and how to execute ideas. If you're interested in learning more about the submission process and what you can expect, I highly recommend reading this article. Please feel free to reach out if you have any questions. 


Badge +1

Ideally, it would work like Grafana does. You set a refresh interval from off to 5 sec to 1 day. And, you set the time frame from last 5 min to last 5 years. 


Userlevel 3
Badge

Right, I understand. 

Then I assume you want to keep it at the last X days/hours/min. What are the typical time frames you look at? And how often would you expect the data to refresh?


Badge +1

Yes, and to scroll the chart to keep it with the current date/time in view on the right.


Thanks

Userlevel 3
Badge

Hi, Peter. 

Thank you for the product idea, and if I understand you correctly, you would like there to be a way to set the chart to automatically update with new values as new values come in?

I will change this post to a product idea and you can track it's progress, and see how others engage with the idea and up vote it. 


Best regards, Knut Vidvei 

Badge +1

I haven’t seen a request for this, but perhaps I’ve missed it. And, perhaps there is already a way to do this - I’m fairly new to Charts.


We have customers who want to have the ability to put up a chart and not touch it and see it update and scroll as time passes. Grafana has some nice features to allow a user to set the update frequency - this is to request is to bring this kind of functionality to Charts. 

Userlevel 3
Badge

Hi @ibrahim.alsyed abd @Brendan Buckbee .

The vessel volume calculations are available now both as no-code in Charts and as Python in the Industrial Data Science Library. Under the category “Equipment” you have calculations for Spherical, Torispherical and Ellipsoidal in both horizontal and vertical orientation. See an example below with the geometry as constants and the tank level as input:


Here is the link to the Python code and more detailed documentation: https://indsl.docs.cognite.com/equipment.html#vessels


Looking forward to you feedback!

Knut J. Vidvei


Userlevel 3

@Knut Vidvei following up on this.

Userlevel 3
Badge

Hello @ibrahim.alsyed 

This has been reviewed and approved, and will become available after testing in staging. I'll give an update when it is available for users here in this thread. 


All the best 

Knut Vidvei 

Userlevel 3

@Knut Vidvei please provide an update on this.

Userlevel 3
Badge

Hi, Ibrahim.

We are working our way through the review process, and will have an update for you shortly.

Best regards, Knut

Userlevel 6
Badge

@Knut Vidvei 

Userlevel 3

@Eric Stein-Beldring any update on when this can be released?

Userlevel 3

Thank you - looking forward to it.

Userlevel 5

@ibrahim.alsyed @Brendan Buckbee, an update on the vessel volume calculations – @Everton Colling has used his pre-holiday time to wrap up the pull request for these calculations:

Our colleagues will be able to review the code after the break and then it should be a part of our first InDSL update in 2023. Until then, have a happy holidays!

Userlevel 5

@ibrahim.alsyed there has been an ongoing discussion among members of our data science team, but unfortunately the function is not yet ready for review or use. We’ll be sure to keep you all up-to-date once we have made further progress and the function is ready for use in Cognite Data Fusion. 

Userlevel 3

@Eric Stein-Beldring  following up on the post by Brendan on volume calculations of vessel above in this thread. Has the data scientist looked at it? can it progress?

Userlevel 5

@Richard Manson Have you tried using the CUSUM function? It has some parameters that you should be able to tailor to detect these changes – likely with one calculation for positive changes and the other for negative changes. 

It might also be worth reposting this in the main Charts group or the Hub community page in order to get more eyes and input on this. 

Let me think about some other ways to solve this using the available functions and get back to you next week. FYI @Cristina Ferrer Teixidor, this was the case I spoke with you about. 

Userlevel 5

@144842 yes, this is absolutely something we intend to support. We recently had a discussion in our team about a possibility for how to do so, so as soon as we have an update, I’ll be sure to let you know.

In the meantime, as you know, the best solution is to zoom in to a smaller range of time to perform this threshold calculation on a lower quantity of data. 

I also see that we need to be displaying a similar status warning if and when this threshold calculation is being run on aggregated/downsampled data (just like we do for calculations). FYI @Magdalena Rut regarding the update for the thresholds panel UI design you’re working on.

Hei Eric,

In Function/Detect/Change Point Detection, would it be possible to add the choice to select “change on positive” or “change on negative” changes in the value of the series of interest? Or does anybody in the group have another way of accomplishing this? 

Hi,

Not a critical feature, but very nice to have. Could the threshold events search in the raw data instead of using the aggregated data points? I am getting 0 hits, but I can see that we are over the limit several times, and when zooming in it will update with correct event count.


Userlevel 5

@Brendan Buckbee that’s a great request. Some of my colleagues in Cognite may have already built a function similar to this for a use case delivery with another customer.

I’ve added this request to our InDSL backlog and will follow up once one of our data scientists are able to work on it. 

Userlevel 1

Celanese - Feature Request - Nice to Have - Vessel Volume Calculations

Vessel volume calculations would be very useful to have given a level time series and some basic inputs about the vessel. Horizontal Vessels in particular are time consuming to set up and lead to overly long calculations (prone to error) in PI in order to get an accurate volume on the vessel. In our industry the 2:1 elliptical heads are almost always what we use in our vessels so having a calculation just for those would help a lot. Eventually it would be good to be able to select a vessel head geometry and get accurate volume results in charts that way. Here’s a resource for the calculations that we use

https://neutrium.net/equipment/volume-and-wetted-area-of-partially-filled-horizontal-vessels/

Thanks,

Brendan

Userlevel 5

Celanese - Feature Request - Nice to Have - Log Scales for Y-axis

Hoping that this is a simple implementation. It would be great if we had the option to toggle a time series’ y-axis to/from log scale without making a calculation to perform a logarithm transformation on the data. 

@Brendan Buckbee thanks, I’ll add this to our backlog. We’re doing some design work now to improve the usability and functionality of the y-axis controls now, so it’s a good time for us to consider how we might add this sort of added functionality UX-wise.

When it comes to how you imagined this feature to work, would you prefer that the scale toggle is only a feature related to the y-axis itself (meaning, no new calculation needs to be auto-created in the background)? Or would you want or expect a new calculation to be automatically added to the chart list when using this feature?

Userlevel 1

Celanese - Feature Request - Nice to Have - Log Scales for Y-axis

Hoping that this is a simple implementation. It would be great if we had the option to toggle a time series’ y-axis to/from log scale without making a calculation to perform a logarithm transformation on the data. 

Reply