Solved

Calculating Percentage good value

  • 6 February 2023
  • 4 replies
  • 62 views

Badge +2

Question from an end user:

What is the best way to calculate the percentage of good values for a time series over a year using Cognite Charts? I have a list of PSVs in various units that I need to see if we have data availability of at least 95% in 2022.


icon

Best answer by Eric Stein-Beldring 8 February 2023, 18:30

View original

4 replies

Badge

I am the end-user in Ram’s question. I’d like to also ask if it is possible to define percent of good values in charts. For example, a good value might be interpreted as:

  1. one good value per hour; or
  2. one good value per 15 minutes

As an example: If a good value is defined as a value every hour, then having 4380 hourly values in a year would be 50% good data in the year.

Userlevel 5

Hi @rsiddha and @stanleychiu,

I believe I have a calculation workflow that will work for this use case:

In the case above, I’m using a uniformly sampled time series (always 1 data point per hour) that produces binary results (1 = on or “good”; 0 = off or “bad”). By setting the range in view to 1 year exactly, I can be confident that there are exactly 8760 data points. If this isn’t the case for your time series data, then you will need to add some additional steps your calculation (e.g. a Resample to granularity function).

The final result of this calculation tells me that, for the past year, 98.9% of the values were “good” (or = 1) for this time series from Feb. 14, 2021 - Feb. 14, 2022. 

Important note: If you’re looking at a time series or time range that requires > 100k data points, this will not work since the application will automatically downsample the time series input and fetch aggregates rather than individual data points (for the time being). If this is the case, one workaround is to “batch” the overall calculation over smaller time windows (when you know the total # of data points is < 100k) and move the plot window-by-window to calculate over smaller ranges – likely stopping after the Integration function to get the total # of “good” data points in each window. This obviously requires you to make note of each result and have a final calculation to get the % result (you can create a calculation with only constants as inputs do this in the same chart).

Let us know whether approach will solve your use case. Looking forward to hearing your feedback!

Badge

Thanks @Eric Stein-Beldring. My time series are all pressure readings currently. It seems like I have to create a synthetic time series that represents good or bad data for each hour. How can I do that? 

Also, I am thinking how I can make this calculation more quickly since I have more than 50 time series that I would like to evaluate?

Userlevel 5

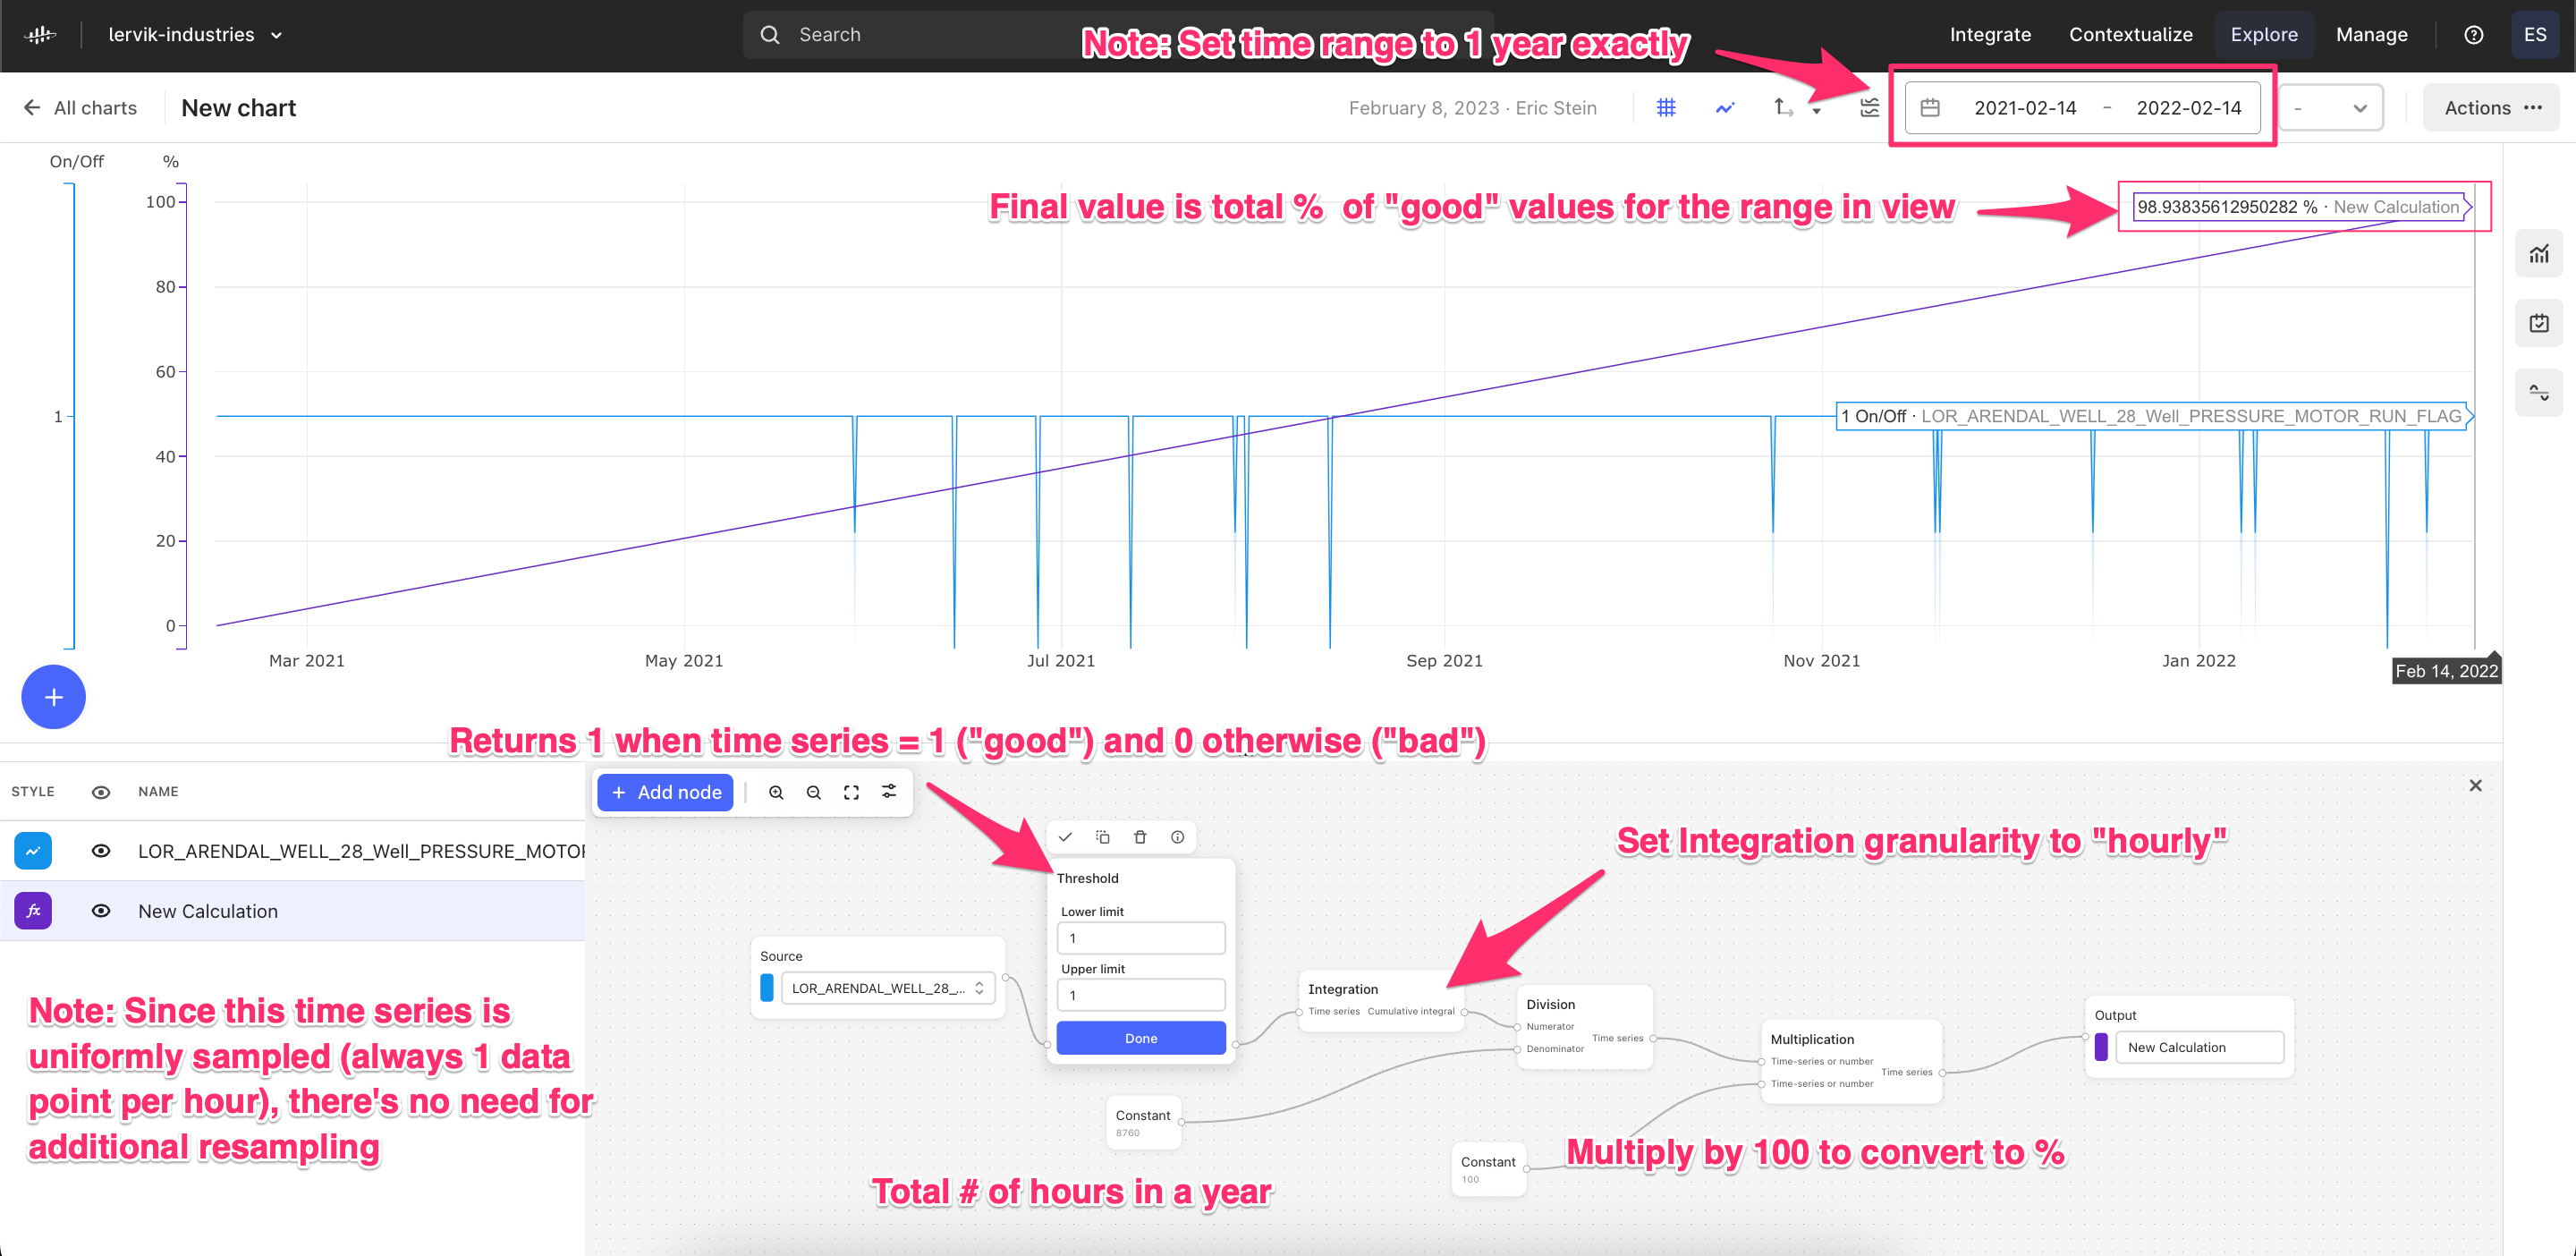
@stanleychiu the same approach should still work, except instead inputing the same value (1 in my example above) in the Lower limit and Upper limit parameters of the Threshold function, you’ll simply input the range that represents the “good” values. 

Therefore, whenever the sensor is within the bounds of the range you specify (i.e. Is of a “good” value), the calculation will output a value of  1, and 0 otherwise. From here, the rest of the calculation will work. Although, again, this is assuming your pressure time series is uniformly sampled (no gaps, no variation in sampling frequency).


When it comes to scaling this to more than 50 time series, this isn’t something that can be entirely done via the UI today and will require the assistance of a data scientist to solve. This can be done by leveraging our Python SDK, Cognite Functions, and InDSL to recreate the calculation – plus the flexibility of working directly in python will allow one to make the calculation more robust (e.g. Different strategies for filling gaps in the time series). Although, this is certainly a workflow we intend to support entirely from the Cognite Data Fusion UI (no coding necessary) – @Knut Vidvei would be the best person to connect with to discuss and to share more information.

In the meantime, you will need to “Duplicate” each calculation (via the  button in the More column) and/or changing the input time series accordingly. It will take some manual work to get it set up initially, but can be used anytime thereafter by changing the date range in view.

Reply