Hello Charts Early Adopter Community,
I know it’s been a bit quiet in this group lately, but rest assured, the team and I have been hard at work. We have just released several new features and fixes to production. You can scroll down to read about each of them in detail.
Please do leave comments below with questions and feedback!
What’s coming next?
We’re in the middle of our development cycle in preparation for the next major release of Cognite Data Fusion in December 2022. There are the two major features our team is working on that you can look forward to having available:
- Moving Charts (charts.cogniteapp.com) into Cognite Data Fusion (fusion.cognite.com)
- We’ve received plenty of feedback that our product experience can and need to be more tightly integrated and we’ve heard you loud and clear.
- As you all know, Charts is currently available on charts.cogniteapp.com, which is separate from Cognite Data Fusion (fusion.cognite.com). Despite starting out on its standalone URL, Charts has always been considered a part of Cognite Data Fusion. We’re now working to unify our product experience and move Charts into fusion.cognite.com.
- This is the first critical step to ensure charting and no-code analytics are integral functionalities of Cognite Data Fusion. For future releases (thru 2023+), you can expect tighter integrations and improved functionalities within Cognite Data Fusion (fusion.cognite.com), with other Cognite applications, and 3rd party tools.
- Of course, it will be quick and easy to ensure all of your existing charts are migrated and available in both URL locations. We’re also working to ensure any external links to charts.cogniteapp.com will be redirected to the relevant location in fusion.cognite.com and/or we’ll help to make any necessary changes. More details to come closer to the release.
- To ease the transition, we will also be having a grace period (TBD duration) during which both URLs are active and available.
- Find and visualize events in the chart plot
- Another longstanding request (see here in Cognite Hub) and a critical aspect of providing simple access to complex industrial data. The ability to analyze and understand data from different source systems in context of one another.
- The ability to search and filter for relevant events (work orders, transactions, etc.) in Cognite Data fusion and display them in your chart, alongside your time series and calculations. This will be a part of our December release.
- We’re working on this feature now and will be meeting with a few of our community members who are eager to give feedback on our UI/UX design proposals.
- Are you interested in testing and giving feedback about this feature too? Wonderful! Please reach out to me (eric.stein@cognite.com) and/or our product designer Magdalena Rut (magdalena.rut@cognite.com) and we’ll be in touch.
In addition, there are plenty of other relevant product initiatives and valuable features that our team is contributing to for this and upcoming releases, so stay tuned for more information before the end of the year.
Details
Charts UI/UX
-
Export calculations as CSV
-
This has been a longstanding request and we’re happy to make this functionality available for those who want to continue analyzing data in any application or tool that relies on a CSV file format.
- All time series and/or calculations you have visible on your chart (i.e. not hidden) will be included in the CSV download. You can still customize the parameters (granularity, time period, etc.) to suit your needs.
- Note:
- Calculations and time series will be downloaded in two separate CSV files.
- We just discovered a bug where the CSV download will fail if a chart name includes a period
.or is too long. A fix for this is underway, but if your download fails in the meantime, double check and try changing your chart‘s name.
-
-
Search results will include time series connected to child assets
- In most cases, people know the tag for the parent equipment (a tank, compressor, well, etc.), but not necessarily the specific sensor beneath it in the asset hierarchy. Previously, the "Equipment tag" (asset) tab in the search panel required you to search for the specific equipment to which a time series is directly connected to find a time series. This makes it unnecessary difficult to find the right data, plus it was inconsistent with the functionality of the data explorer UI in fusion.cognite.com. See here on Cognite Hub.
- Now, it’s simpler to find and access relevant data in Charts. Whether you search for the equipment tag for a parent or its children, you’ll find the same time series.
- For those of you who are familiar with the CDF time series API, this means displaying time series results for both the
assetIdsandassetSubtreeIdsfilters. (i.e. All of the time series linked directly to that asset, as well as all of its children)
- For those of you who are familiar with the CDF time series API, this means displaying time series results for both the
- Next, we’re working on adding support for displaying time series data related to equipment tags (assets) via relationships as well. This is a WIP and will be made available in the coming weeks.
-
Errors and warnings for calculations
-
In the past, you would have needed to open the developer tools in your browser in order to see an error message when a calculation failed. Neither simple nor intuitive.
-
We’ve now added a
Statuscolumn to the table below your chart, which will display an error or warning icon for a given calculation if and when it occurs. This panel is also accessible from within the no-code calculation editor:
- As you can see, the error messages and warnings will now reference the specific function or source that triggered it. This should help with finding or troubleshooting the issue.
- Note: If both an error and warning are triggered, we will always display the error icon, as it is the more significant.
-
While we still have some work to do when it comes to improving the readability and intuitiveness of the error messages themselves, this will make it much easier for you to figure out going wrong and relay to us in the product team to help troubleshoot an issue.
-
In future updates, we’ll be able to display these warnings and errors on the specific function node itself from within the no-code calculation interface to make it even easier to find and troubleshoot a particular issue.
-
-
Time series description is updated in the Charts table whenever it’s updated in CDF
- Previously, this was a static property that did not change if and when a time series’ description was changed.
-
Results count displayed alongside “Time series” tab in search panel
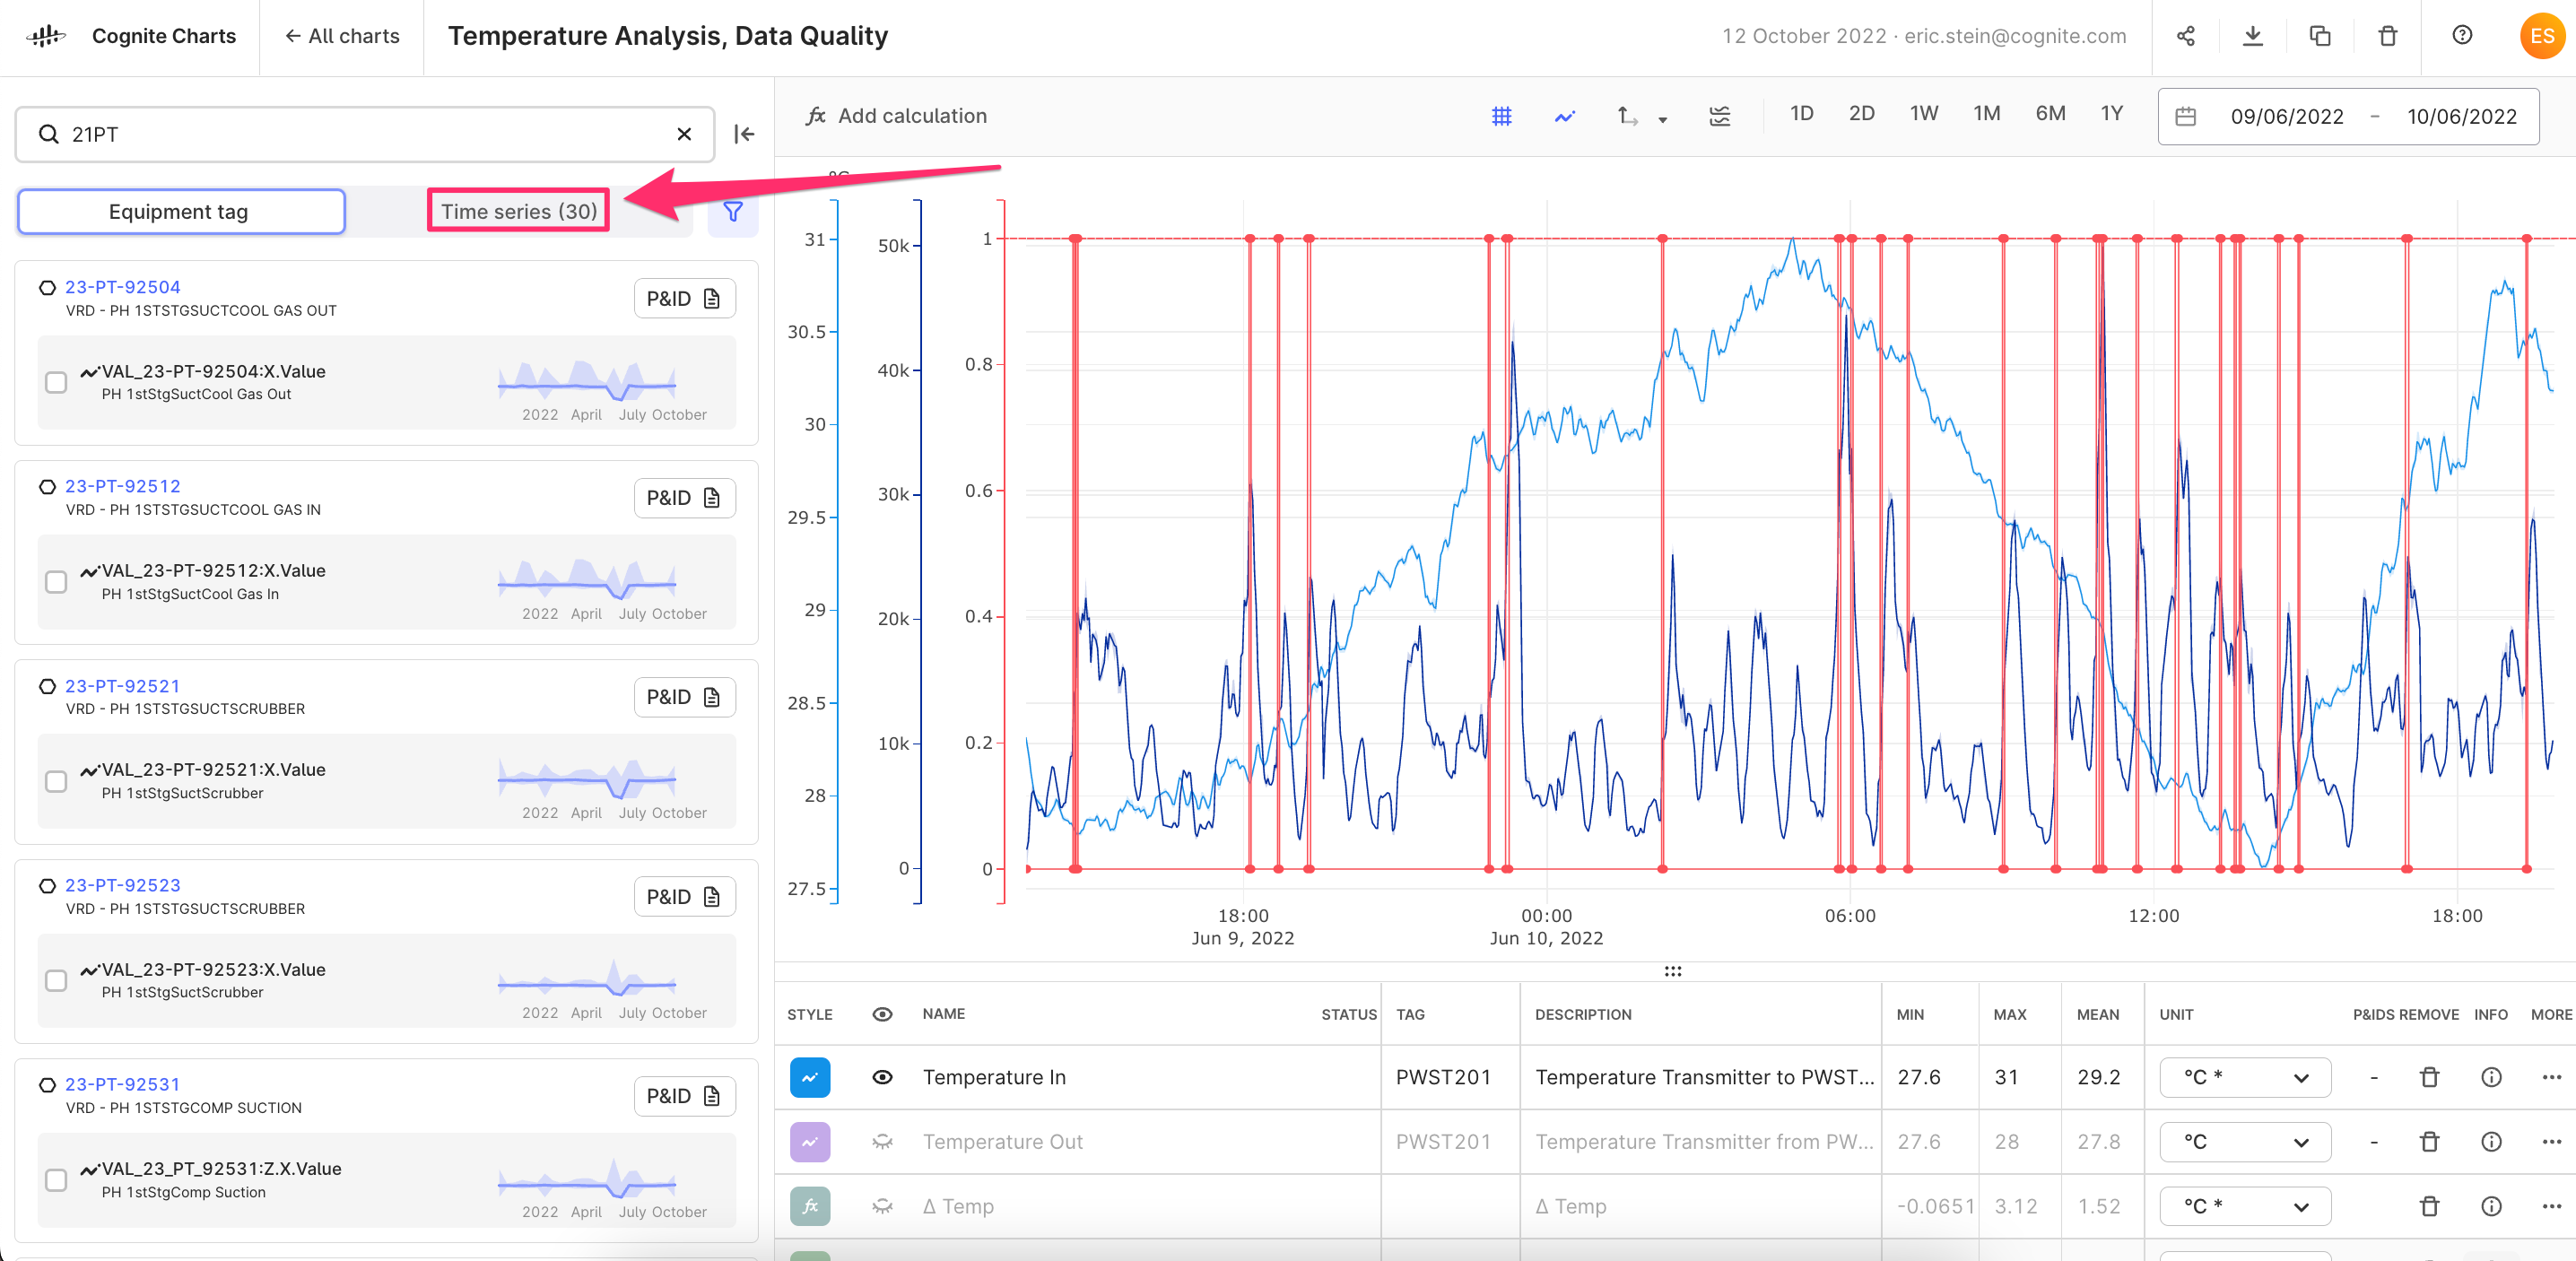
- This makes it easier to see whether and how many time series results (up to 1k) you have for a particular search query while using the “Equipment tag” tab.
-
Improved empty states
- When you have no private or public Charts on the start page
- When creating a new chart, the search panel will automatically be opened and include a list of your most recent searches.
-
Plenty of bug fixes + quality improvements
- Including a bug fix for when a calculation would fail when using the outputs of multiple calculations.