
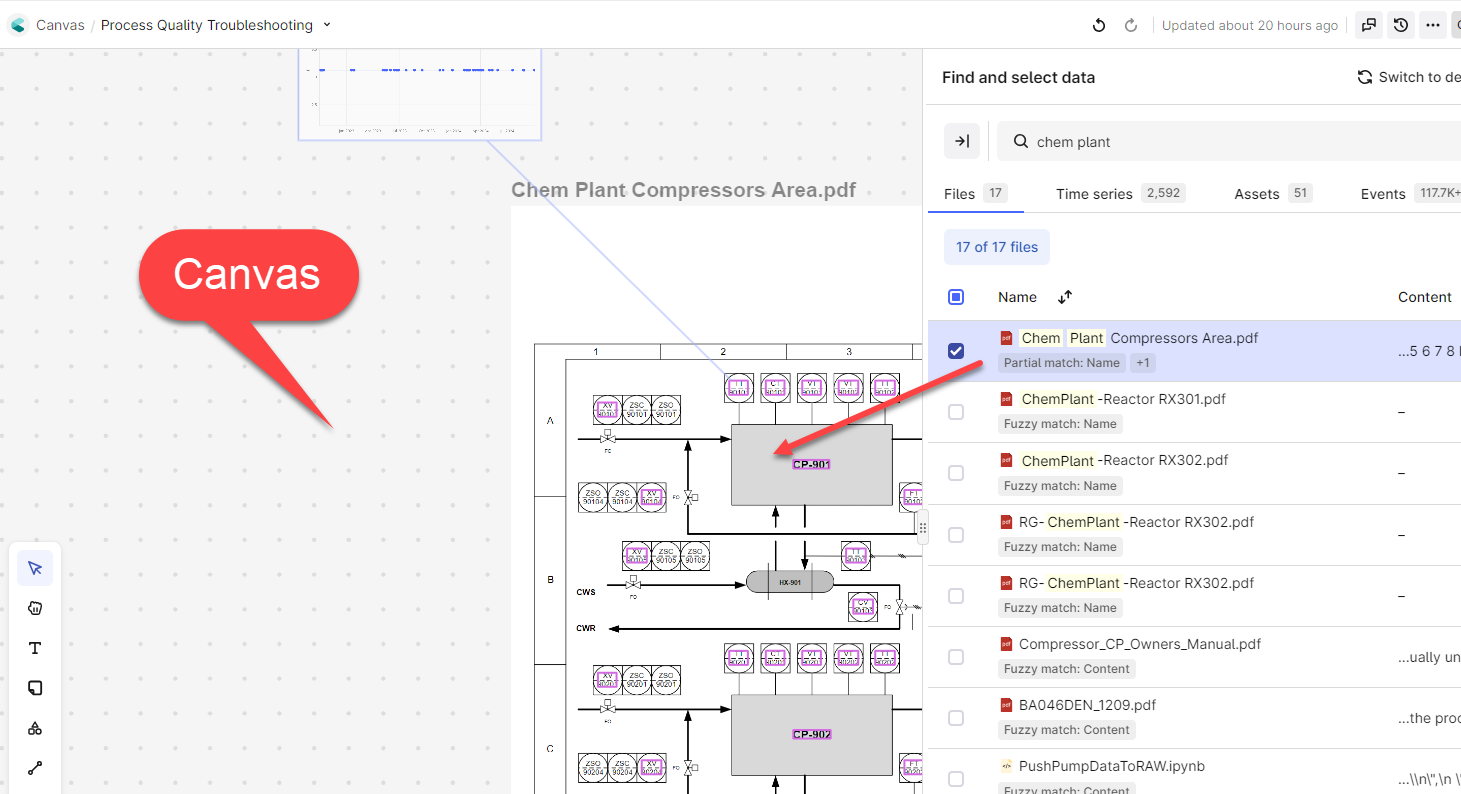
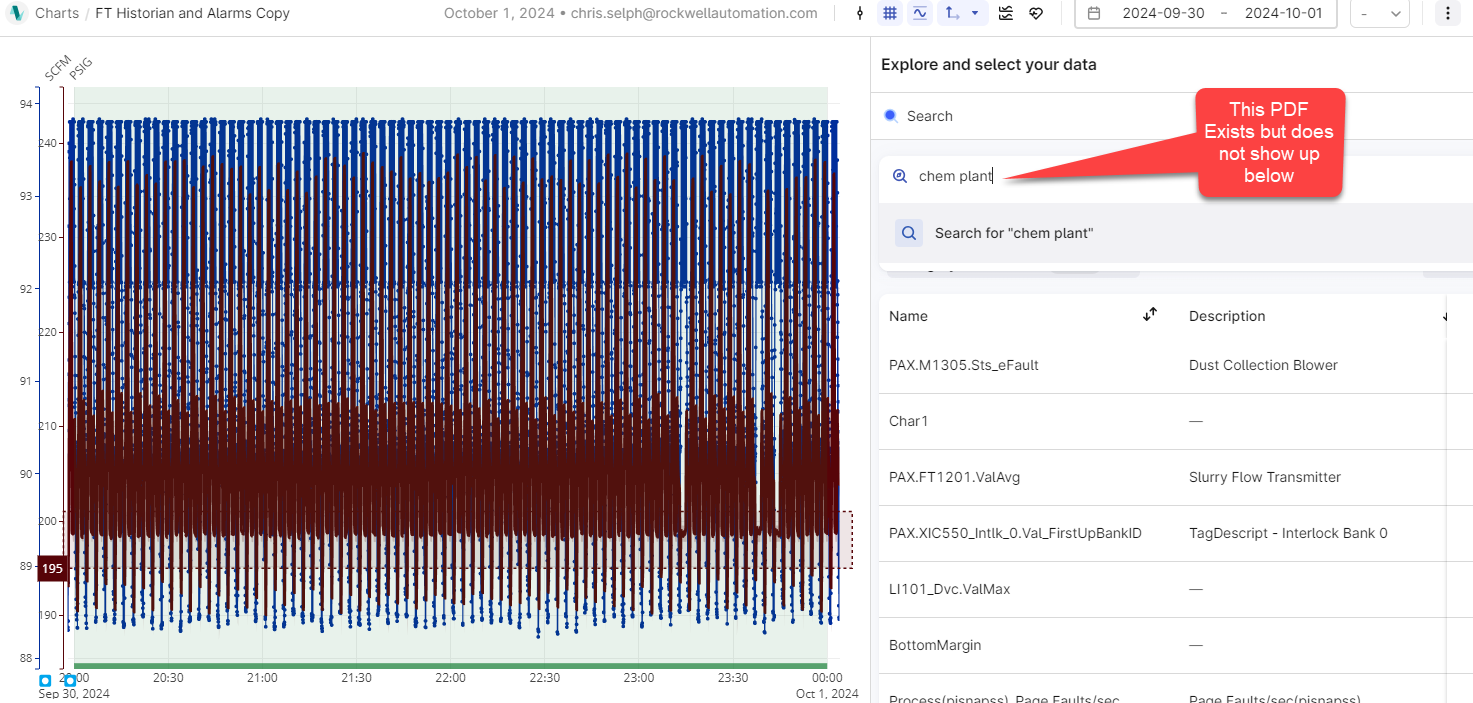
Recently the user interface in Charts has changed. I’m not seeing the ability to add timeseries via a PID in a contextualized PDF file. See the image below. Is that capability not available any more?

You can see the PDF from the Industrial Canvas UI:


Hi @Chris Selph,

Can you please check again by pressing enter after typing the name of the file in the search bar and change the category to “File”? 

Please refer to the below screenshot.


@Chris Selph were you able to find the correct PDF in Cognite Charts?


Reply