

 Check the
documentation
Check the
documentation Ask the
Community
Ask the
Community Take a look
at
Academy
Take a look
at
Academy Cognite
Status
Page
Cognite
Status
Page Contact
Cognite Support
Contact
Cognite Support

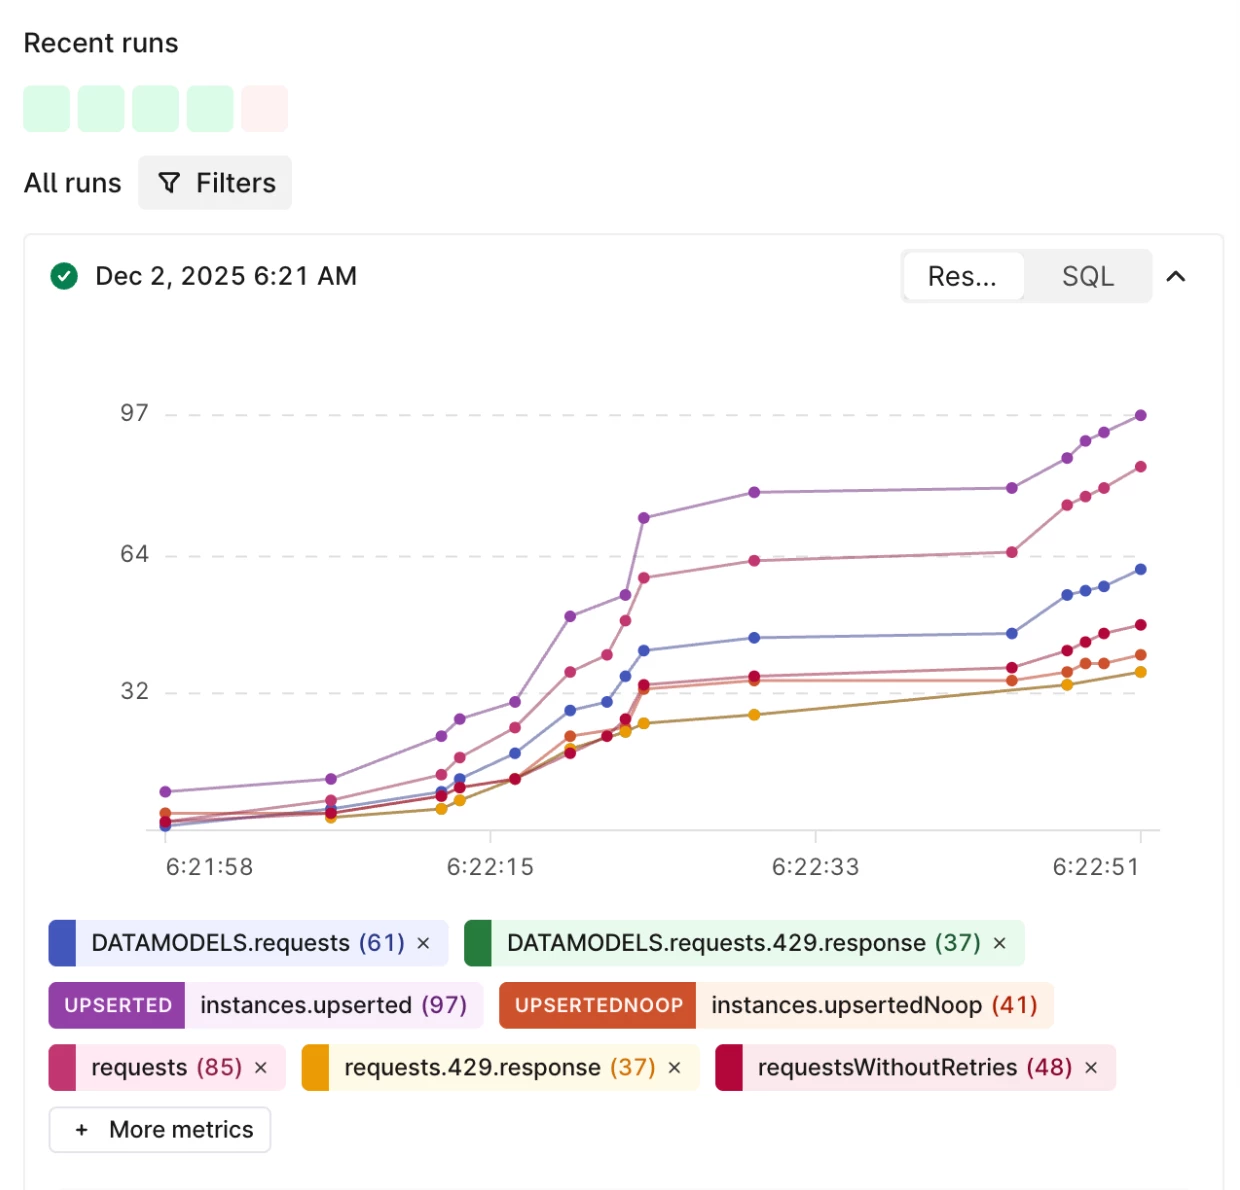
Understanding the inner workings of your data pipelines is key to taking action to improve performance and debug issues. To give you better visibility, we’ve unlocked the full library of transformation metrics directly in the Transformations Run History UI.
Previously, the UI only showed a few key metrics. Now, you can access everything the API tracks-from specific rate limits to granular resource updates-right from the graph.
Navigate to the Run history tab in the Transformations UI, and select more metrics as shown in the images below.
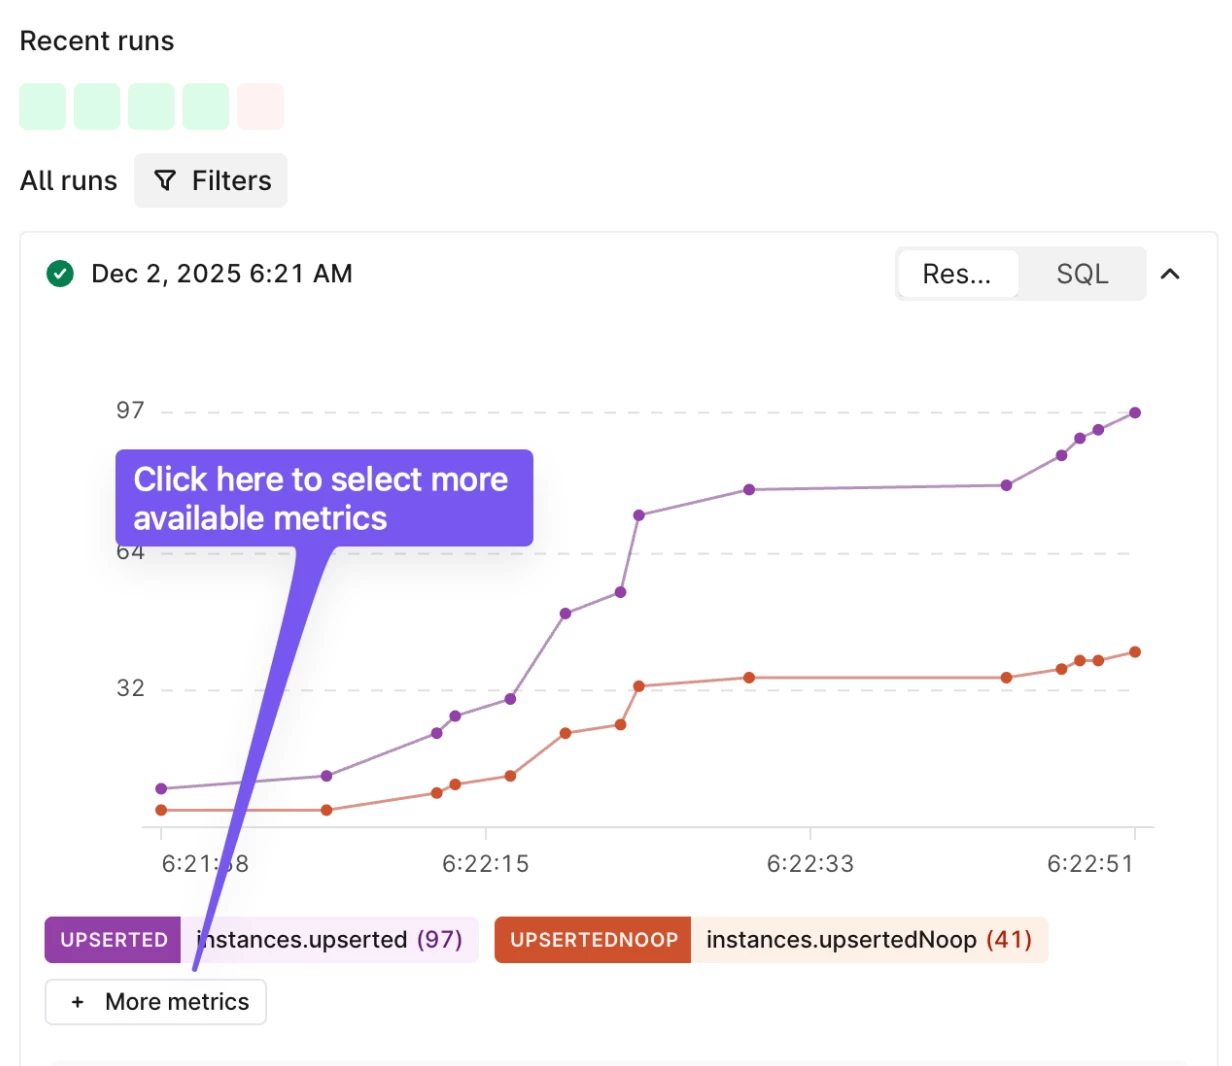
What’s New?
- Searchable Metric Selector: Use the new dropdown to find exactly what you need. With the new search bar, you can quickly filter through long lists of metrics if you're working with multiple tables or data models.
- Smart Defaults: To keep things clean, your most important metrics (like reads, updates, and total requests) are still shown by default. Everything else is just a click away.
Identifying Efficiency Gains
This update makes it easier to track the instances.upsertedNoop metric we recently introduced. By comparing "upserted" vs. "upsertedNoop," you can see exactly how much data is being re-written unnecessarily. High "No-op" counts are a clear sign that you can save time and compute costs by using smarter, incremental loading.
Give it a try!
Head over to your Transformations Run History today to explore these new insights. We’re always looking to improve, so please share your questions or feedback in the comments below!