

 Check the
documentation
Check the
documentation Ask the
Community
Ask the
Community Take a look
at
Academy
Take a look
at
Academy Cognite
Status
Page
Cognite
Status
Page Contact
Cognite Support
Contact
Cognite Support
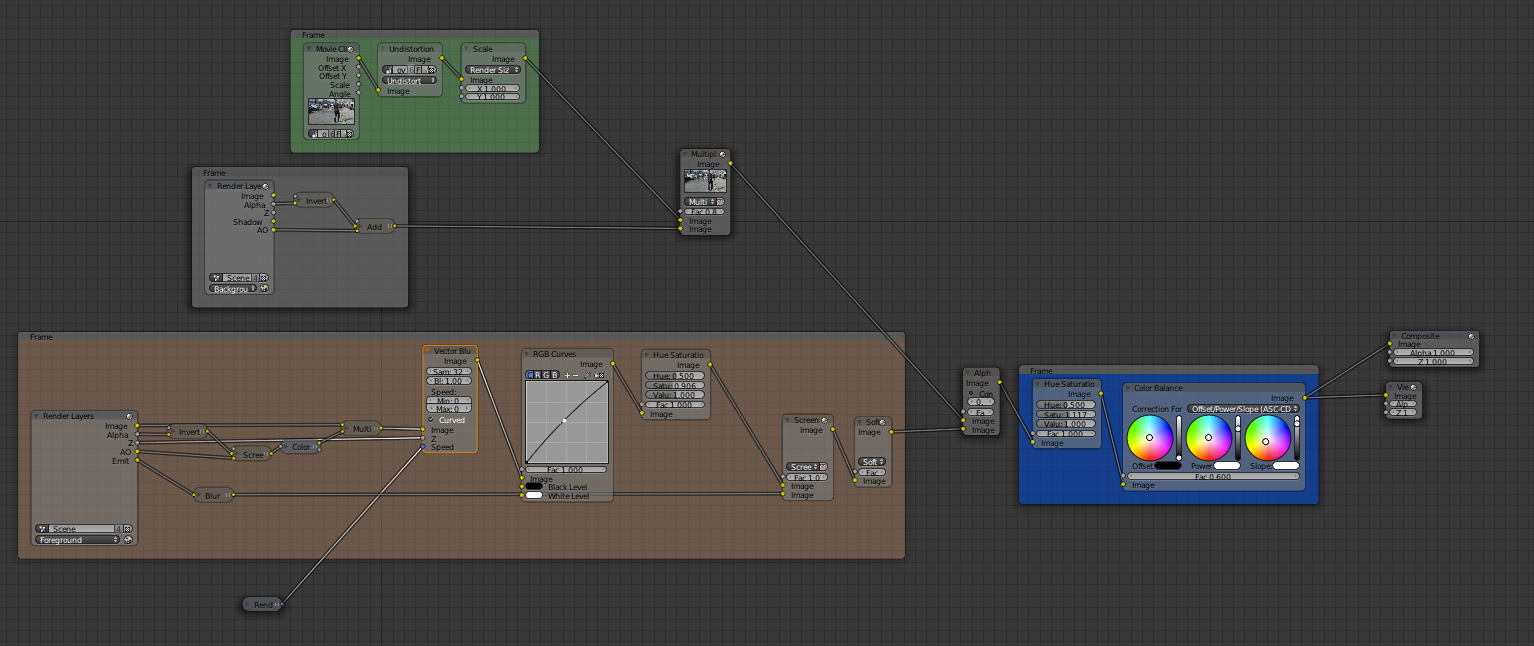
The node based calculation editor is neat, and offers a visual way of building quite complex TS transformations and calculations. But, the “visual complexity” grows quite fast, and I am missing a basic feature common in such node editors where the user can add colored boxes with a title behind some of the nodes. In this way we get some structure and documentation into the calculation, and it becomes easier for the user (and other people as well) to quickly understand what exactly is being done.
Here is an example from Blender, which uses a node editor to build complex ray tracing models:
Regards,
Anders Brakestad
Another great suggestion and one that we’ve also discussed. We’ve also discussed being able to “minimize” a grouping of nodes, to make it easier to visualize large calculation workflows.
This is also closely related to your other request regarding being able to share notes or documentation. One simple feature suggestion we’ve discussed is being able to have an empty “node,” which is a free text block where you can add details, explanations, and context for what a calculation is doing, why you’ve set particular parameters, etc.