Check the
documentation
Check the
documentation Ask the
Community
Ask the
Community Take a look
at
Academy
Take a look
at
Academy Cognite
Status
Page
Cognite
Status
Page Contact
Cognite Support
Contact
Cognite Support


Hello,
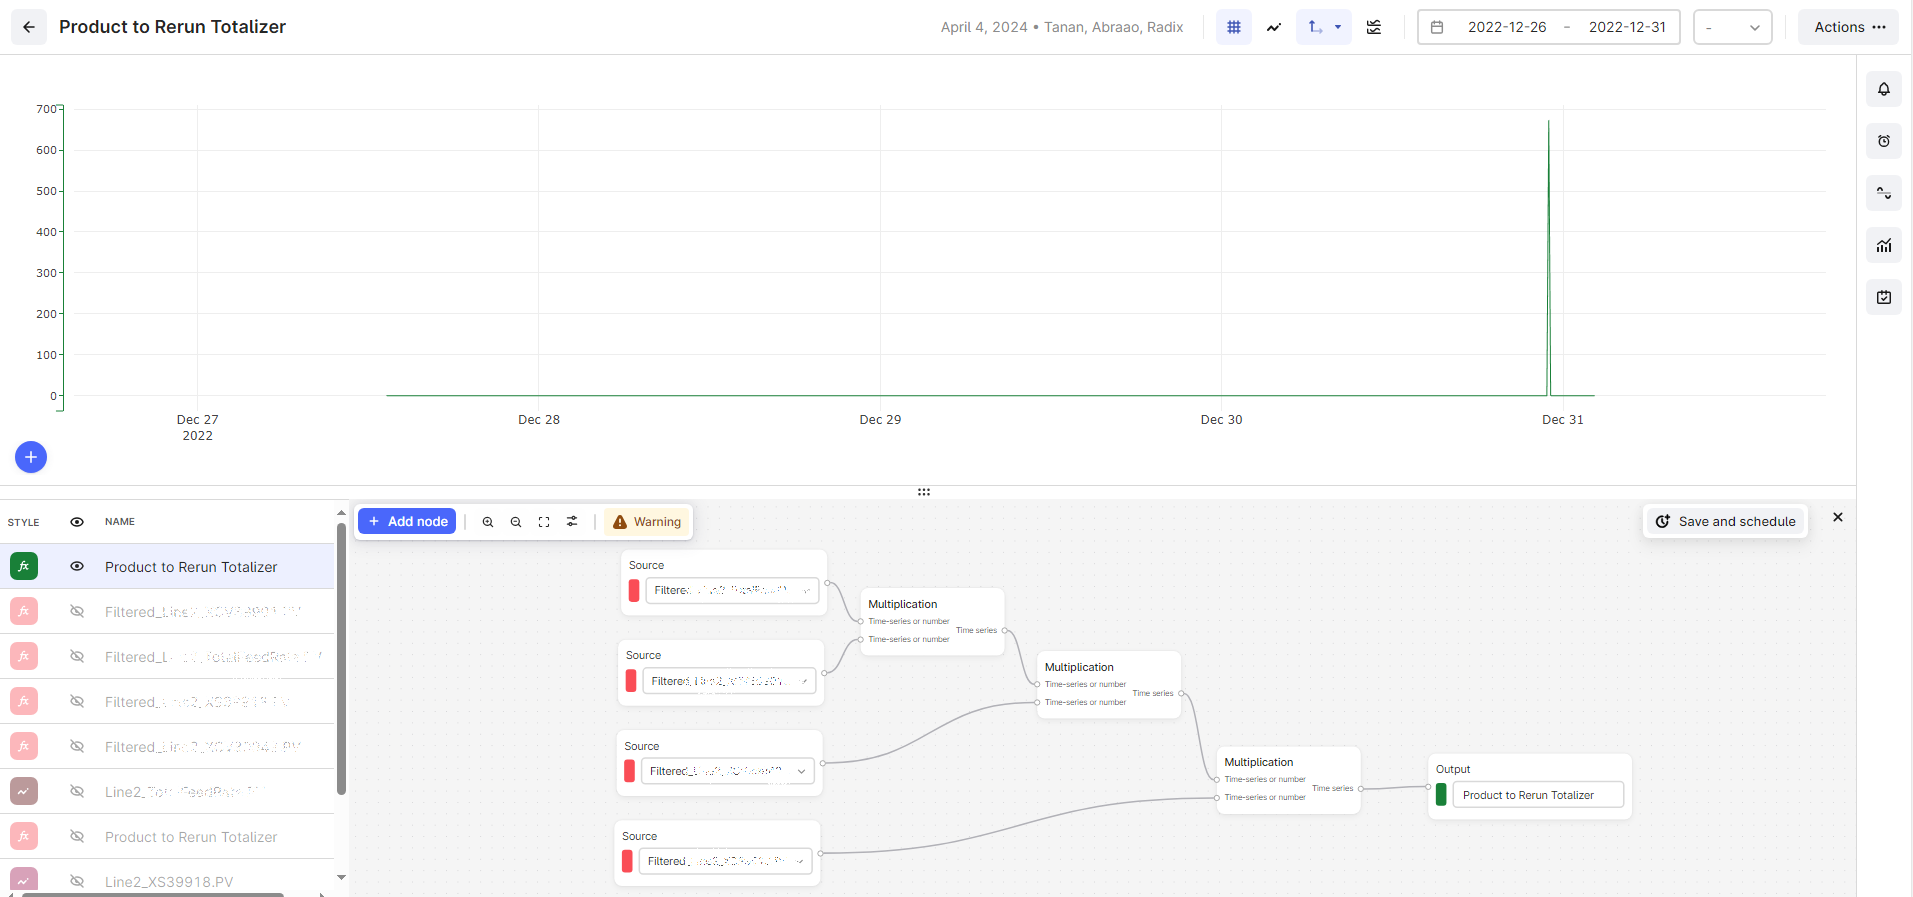
I am trying to perform a calculation on Charts but it does not work. It is a multiplication of 4 time series, all of them with a resample to granularity to 1m. One of them has real values and 3 of them are 0/1 steps.
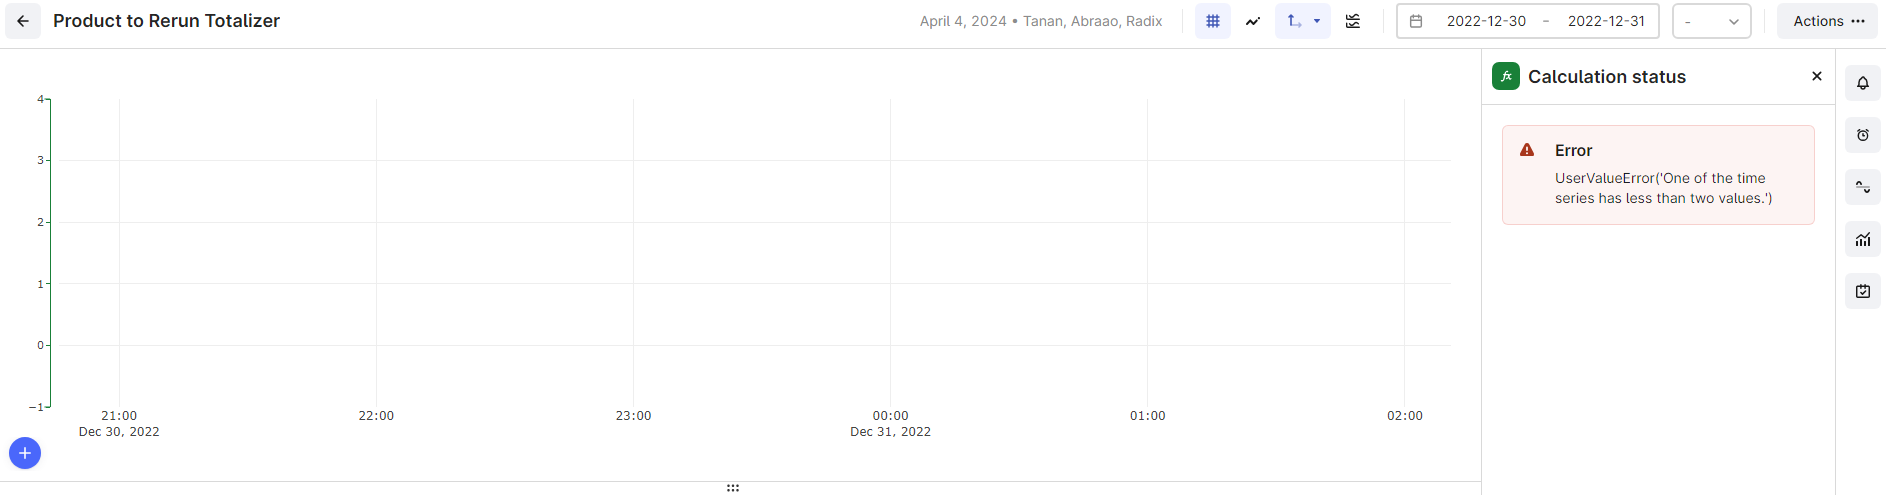
When I zoom out, I can see the calculation and it shows a pick of values, that is not accurate as it shows average data. Although when I zoon in to see the data, the trend disappears, the error says “One of the time series has less than two values”.
As I resampled the data to 1 minute, I was expecting to see one values per minute, but it does not seems to happen. Is there other way to calculate the data correctly?
Zoom in: