Hi!
Good question! We agree, and it’s on our todo-list
For now, though, you need to identify the holes. Either prior to query, or by manual inspection afterwards (if all inputs are missing, the result will always be a straight line).
The proposed idea is to let the user set a limit on how far we should interpolate. “Never interpolate gaps > 1 day”. I will add you to the task though, so that we can include you in the discussions when we make the final design.
Best,
Matias
Time series team
Yeah, something like that. But the time-to-live-field must be provided by the user.
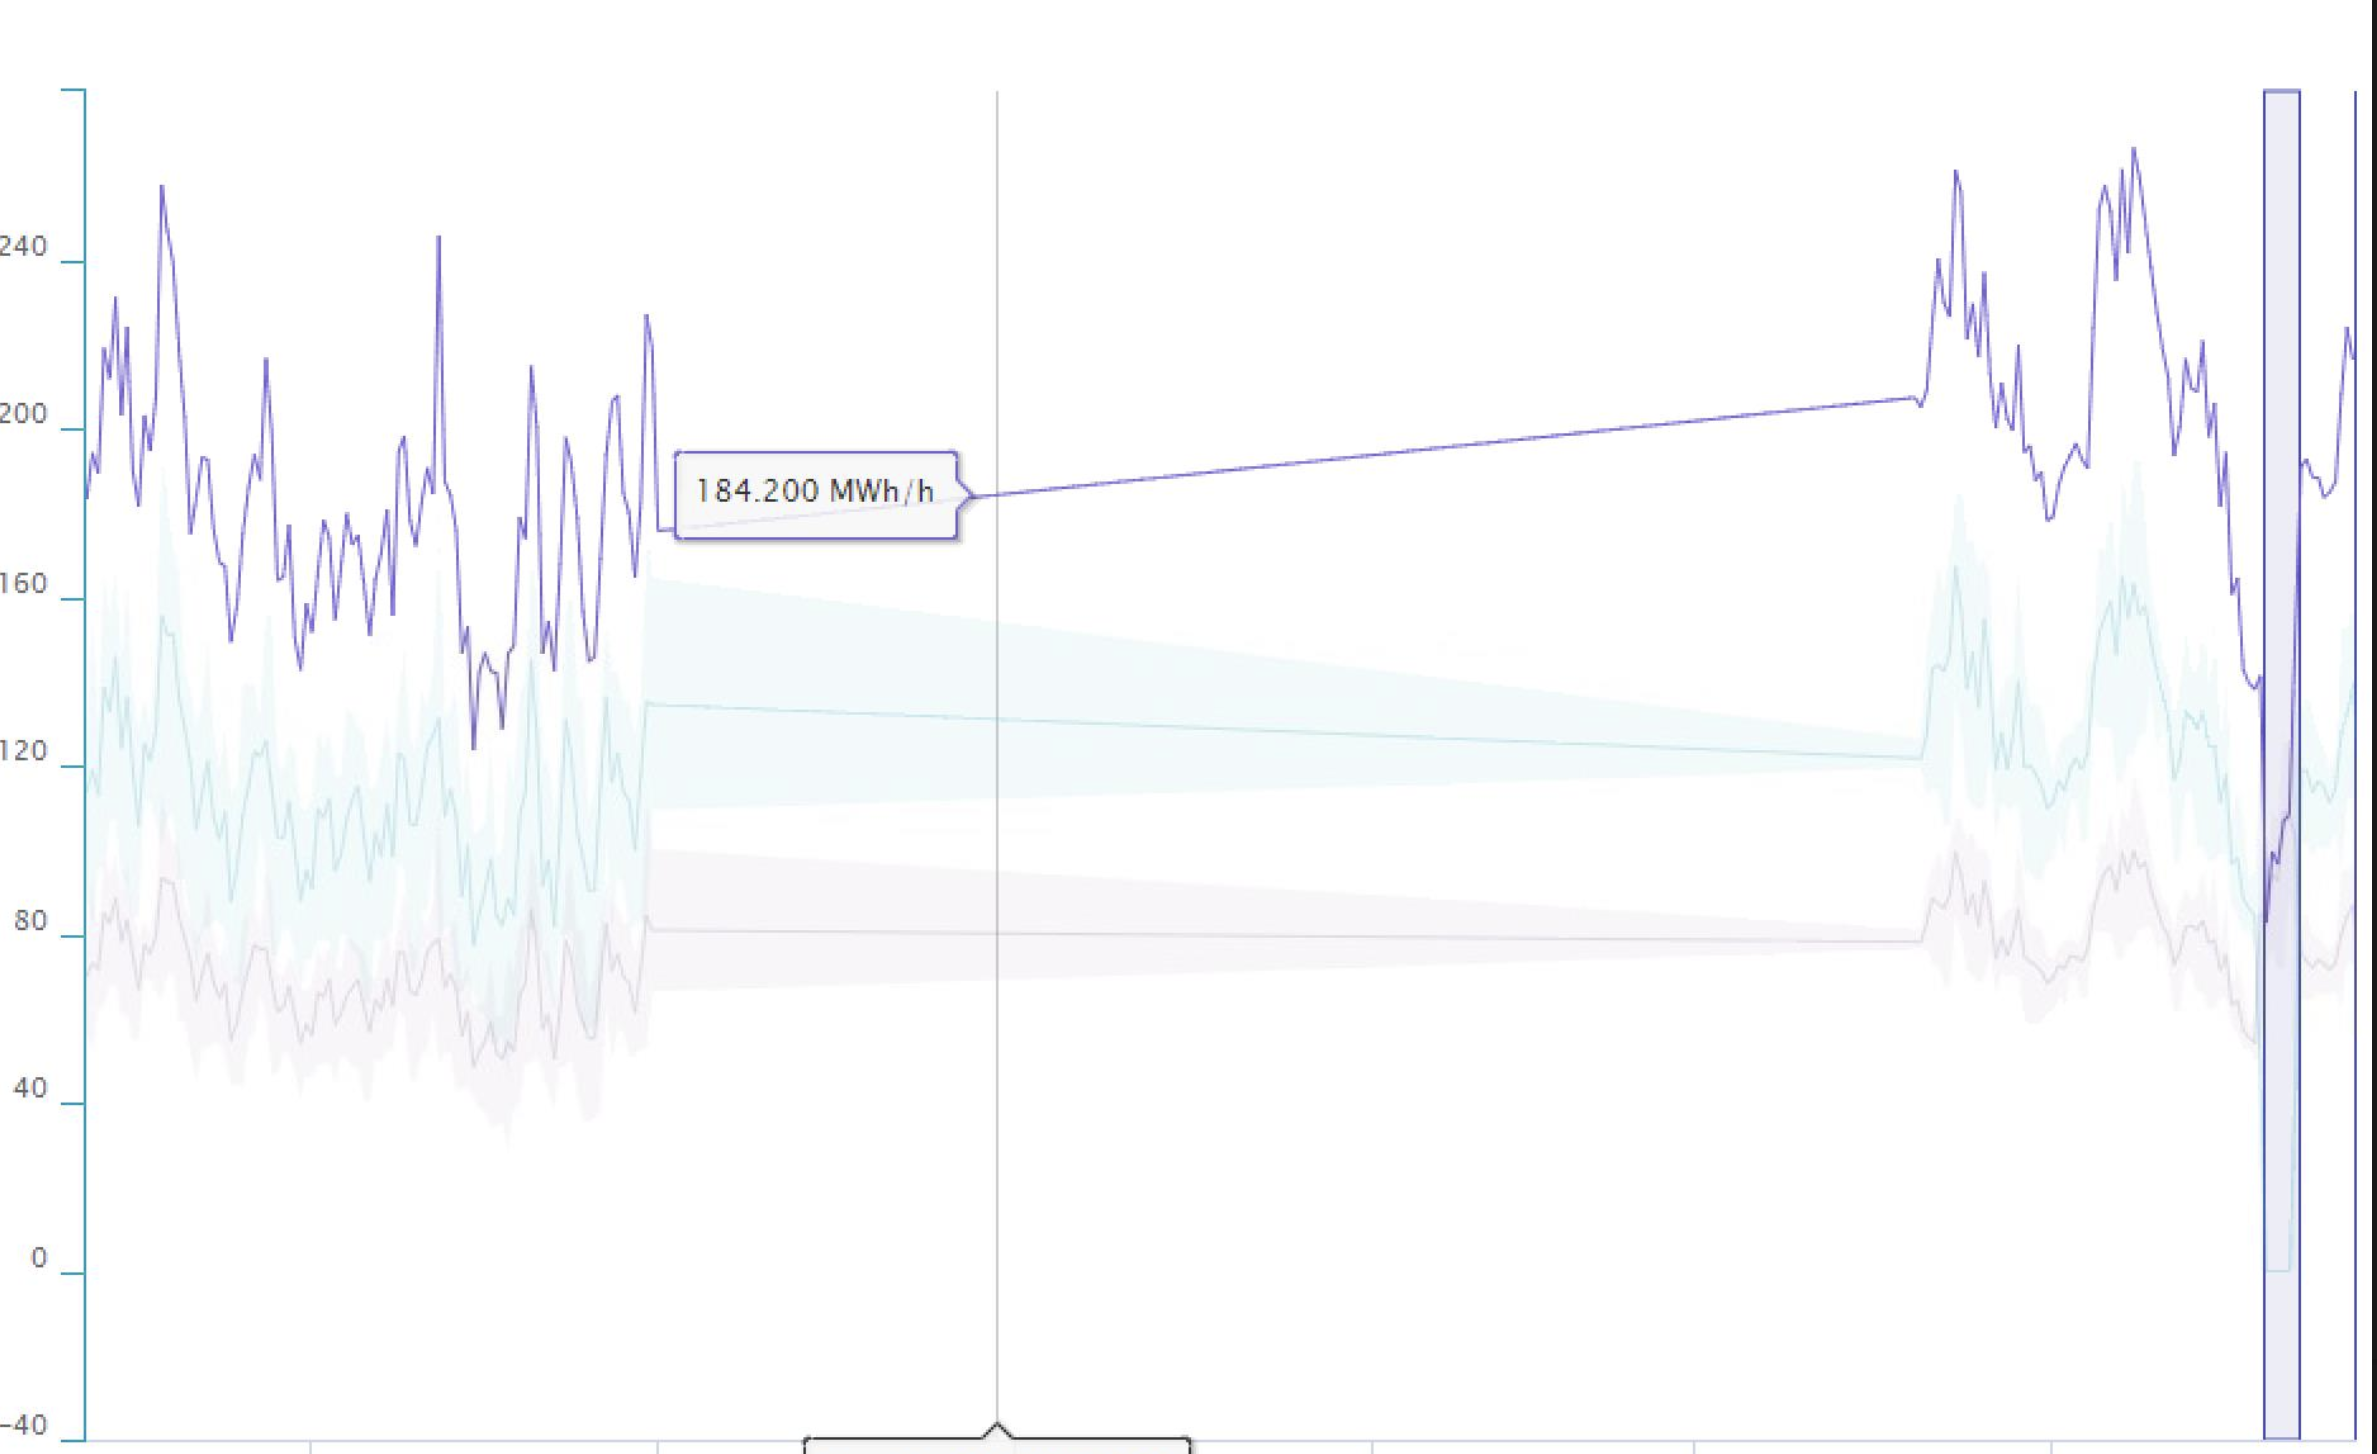
Synthetic time series is also more complicated. In normal time series, it’s easier to reason around gaps. A gap means missing data, and you can fill it in by drawing a line between the start and end of the gap.
For synthetic time series, it’s not easy to see which of the input time series are missing, or how to fill in the gap. Thus, we need the user to be much more explicit in how the missing data should be treated, and what constitutes missing data.
It’s worth noting that this is a problem that has cropped up twice in our solutions.
@Ola Øyan can probably comment on the value of these solutions - Custom Calculations and Power Transfer Corridor flow timeseries.
We’ll be very glad to be included in the task, and kept up to date on its priority.
Thanks for helpful and prompt replies to our questions!
Representing long term synthetic time series with a representation of min/max of at least 1 hour granularity is an important issue for our users, the power system analysts. They typically want to sum the power flow over several components over several years, and see at least a good approximation of the maximum and minimum flow.
- The max and min values should represent the max/min at least one hour granularity to make it comparable to the capacities of the limiting component in the grid.
- The syntetic time series should take missing datapoints into account, because it is not uncommon for time series to have gaps. Most of these gaps are identifiable by events, such as disconnections but also integrity events that @RobersoSN has created.
It quickly becomes complex to fix this on our side, so supporting features from Cognite are greatly appreciated.
Thanks for helpful and prompt replies to our questions!
Representing long term synthetic time series with a representation of min/max of at least 1 hour granularity is an important issue for our users, the power system analysts. They typically want to sum the power flow over several components over several years, and see at least a good approximation of the maximum and minimum flow.
- The max and min values should represent the max/min at least one hour granularity to make it comparable to the capacities of the limiting component in the grid.
In synthetic time series, we have currently focused mostly on instant-based functions. So we have implemented min/max over different inputs, at any given point of time. That doesn’t work well with millions of input data points though.
For sum of power flow, we have the average, which can be multiplied by time to get the integral. Max/Min aggregates are a relatively low-hanging fruit, which we have plans to implement.
Something that is more challenging though, is to do max_1h(TS_1+...+TS_N). That is, to add timeseries before we take the aggregate. In that case, we would need to create a new time series TS_sum, and fill it with datapoints that represent the sum, which we then could aggregate.
- The synthetic time series should take missing datapoints into account, because it is not uncommon for time series to have gaps. Most of these gaps are identifiable by events, such as disconnections but also integrity events that @RobersoSN has created.
Just to be sure I understand correctly. You have cognite events that describe disconnections, and you want to combine events and timeseries? That will require quite some integration work on our side, but it’s a very interesting proposal.
Otherwise we could implement something similar to on_error, but expanded. So you could say that “if some condition is true, omit returning data points”. Where the condition could include “time since previous data point”.
If it’s ok for you, I’ll add you to the task, so we can use your input when we start working on it :)
Great, thanks.
- For sum of power flow, we have the average, which can be multiplied by time to get the integral. Max/Min aggregates are a relatively low-hanging fruit, which we have plans to implement.
I think this is a solution that will work well for us in most cases. Over time periods where each time series have reaced min or max at different times, we will overestimate the min/max, but I don’t think this is an issue very often. The consequence of overestimating min/max is not of great importance either. If we could get one new feature, this is the one I would wish.
- Something that is more challenging though, is to do max_1h(TS_1+...+TS_N). That is, to add timeseries before we take the aggregate. In that case, we would need to create a new time series TS_sum, and fill it with datapoints that represent the sum, which we then could aggregate.
We have done this through Cognite Functions on quite a few time series. We have discussed a feature where we create a new time serie on demand using the same feature, and then calculate the syntetic time serie data point by data point. Do you have any idea of how long it would take to create a new time series this way?
We have quite a lot of datapoints: Usually one new datapoint every 10 seconds and over 5-10 years. But using a granularity of up to 1 hour could also work very well.
Creating new time series is fast, < 1 second. Populating it with data through Cognite functions is slower, order of magnitude 10M datapoints/minute. So 1-2 minutes for the 0.1 Hz time series over 5-10 years.
Then of course you can create a synthetic time series based on the un-aggregated datapoints, and fetch them 10000 points at a time. If you have <10 inputs, I estimate that it should take < 1 second. More inputs, and it may be slower. And then you can manually upload these datapoints to a new time series. So, a similar performance to Cognite functions I suppose. But you don’t get the convenience of having Cognite Functions run on a schedule every X minutes, to keep the data points up to date.
It will be faster to base it on aggregates, as long as each aggregate contains at least a few points. And that way, the input data points will be perfectly aligned, and it is easier to add them together - you don’t need to interpolate