Solved

Guidance Needed: Implementing Time-Series Analysis with Cognite Python SDK

  • 25 July 2023
  • 2 replies
  • 109 views

Userlevel 1
Badge

Hello Cognite Community,

I'm currently in the process of deepening my understanding of the Cognite Python SDK, and I've encountered some hurdles that I believe this community could help me overcome. I'm working with a time-series dataset and aiming to use it to make machine learning-based predictions. To facilitate a more comprehensive response, I've provided a snapshot of the data I'm working with and detailed my queries below.

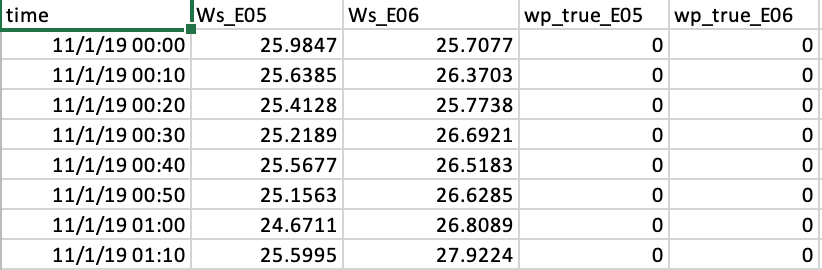
Dataset Structure: The data comprises 5 columns: time, ws_E05, ws_E06, wp_true_E05, wp_true_E06. The 'ws_E05' represents the true wind speed at location E05, and 'wp_true_E06' signifies the true wind power at location E06.

Query 1: I plan to utilize this dataset to forecast the subsequent 10 minutes using Linear Regression in the Python SDK on Cognite. Could you advise me if the present state of this time-series data is sufficient to get started, or are there certain modifications or preprocessing steps I should consider? I'm also interested in visualizing this data using the Python SDK, if possible.

Query 2: Given my data structure, would it be beneficial to use Cognite Data Fusion (CDF) to create a separate dataframe with 'E05' and 'E06' as assets? Should I incorporate this time-series data into CDF before utilizing the Python SDK?

Query 3: I'm exploring the concept of creating a digital twin for importing data, running my algorithms, and exporting data for future predictions. Considering this, why would incorporating this data into CDF or even using Cognite be advantageous compared to purely using Python? In other words, how exactly can CDF or the Cognite Python SDK enhance my project's efficiency or effectiveness?

Please note that I've recently embarked on the Python SDK course, while having already completed the CDF Fundamentals course. However, I'm still uncertain about how to apply these learnings to my current project. 

Your guidance on these matters would be immensely beneficial. I apologize if some questions seem elementary; I'm still in the early stages of mastering these technologies. I'm eagerly awaiting any advice or insights that would help me navigate these issues more effectively.

Thank you for your time and consideration.

Best Regards,

Vishnu Iyengar

icon

Best answer by HaydenH 25 July 2023, 10:44

View original

2 replies

Hi @Vishnuvallabha Iyengar, these are all great questions. I will try to help you as best as I can.

  1. This format for the data is fine, however in CDF, each of these time series (columns) you have would be in their own time series. The main point is to attach information to the objects you are interested in such that you can query those which you want. For example, if you wanted all the time series objects at location E05, you could add a metadata field to them such that you can call them that way. Similarly, you could add a description field that would allow you to retrieve all of your wind speed time series. You could attach all the time series at a given location to an asset that represents a factory/site as you have suggested. The visualising part however, is not something I would necessarily recommend (the Python SDK does not provide this kind of feature). You have two options here: 1. use the visualisation available in the Fusion browser (including Cognite Charts); or 2. convert the CDF data model objects into something interpretable by Python/Pandas/NumPy and then plot it from there. I should also add that you do not need to have evenly spaced data to start with, as CDF will pre-calculate aggregates (e.g., you could ask for data that is sampled for every hour, minute, etc and with a given aggregate function such as mean, min, max, and others).
  2. I would personally be retrieving multiple time series objects in one hit (or rather the data associated with them) and then you have a to_pandas() method which can convert it to a DataFrame (which means you can use all the pandas/numpy functionality). This is because the latency between calls in CDF (if you have a lot of them) can quickly add up. So it is best to minimise the number of calls where possible.
  3. I am a data scientist at Cognite and have delivered my fair share of UCs to customers and build on top of CDF. I think the largest benefit for me is a lot of the heavy lifting is already done and I only have to use Python to achieve large-scale success and deployment of models. If you want to schedule jobs, you can do that with Cognite Functions, and you can also set this up such that it provides alerting if issues are discovered. I can also avoid writing any SQL, and I don’t need to worry (much) about infrastructure. However, I think that much of the benefit depends on the scope/maturity of the deliverable/solution is (if we think along an axis where the earliest phase is more research/exploration-oriented and the opposite end is a fully-scaled and delivered solution). CDF is nice to use along any part of the journey, but I think the real benefit comes to when you have deployed a solution and have it serving customers. I am of course, just a data scientist, so it might be valuable to get the thoughts from others as well. You mentioned Cognite Charts in your tag, this is something that can be used by SMEs who want to perform calculations but do not necessarily have the coding knowledge. Empowering this user group is also a benefit. I use it sometimes too if I want to quickly visualise something without coding. Although I have not been on any use cases that have made use of Flexible Data Modelling (FDM), this is also another alternative to the asset hierarchy-based approach mentioned above. This allows one to take advantage of graphical queries using graphQL. So now you could ask questions like “get me the neighbouring sites of site X”.

I hope this helps answer your questions! 😀

Userlevel 1
Badge

Thank you so much for the detailed and insightful response! It has greatly helped me in understanding the utility of Cognite in my project. Your point about adding metadata and description fields for easy data retrieval is well taken. I will certainly implement this in my approach to facilitate a more efficient querying process.

Regarding visualization, it's clear now that I need to adapt my data into a form interpretable by Python/Pandas/NumPy to plot it, or leverage the in-built features in the Fusion browser. Your mention of the CDF's capability to pre-calculate aggregates is very helpful and adds another dimension to my approach towards data processing and analysis.

Your suggestion to retrieve multiple time series objects at once to minimize the latency is excellent. The to_pandas() method will indeed be handy for data manipulation and exploration in my upcoming tasks.

It's enlightening to learn from your personal experience at Cognite and how you utilize its features in the scope of data science. It appears that Cognite, specifically CDF and Python, provides a very robust platform for model development and deployment, without having to worry much about infrastructure or extensive SQL usage.

Your explanation of Cognite Functions for scheduling jobs and alerting is certainly appealing and seems to fit well into the scope of my project. I am also intrigued by the capabilities of Cognite Charts for those not well-versed in coding. And lastly, the concept of Flexible Data Modelling (FDM) and the potential to leverage graphical queries is something I am excited to explore further.

I appreciate your advice and experience sharing, it has certainly been beneficial in setting a clearer path for me as I continue my journey with Cognite. I'm grateful to you for taking the time to guide me and would love to keep this discussion ongoing as I progress with my project.


Reply