Grafana data source. Feature request / alternate solotions?
Hi.
It would be useful to access metadata from time series in Grafana. Some of our time series contain simple integers 0, 1, 2.., and the meaning of each value is a string described in a metadata field set on the time series.
Could this functionality be added to the CDF Grafana data source?
Or is there a way to access this information in Grafana through another Grafana plugin?
I see that there is a CDF PostgreSQL gateway, but its documentation says that it’s only for writing data to CDF, so assume this cannot be used for fetching timeseries metadata through the Grafana PostgreSQL data source?
Page 1 / 1
Hi Kristian,
To better assist you, it would be beneficial if you could provide some examples of the states associated with the integer values, along with how they are currently stored in the metadata field.
Additionally, it would be helpful to know how you plan to utilize this information in Grafana. Are you planning to visualize the state text directly on the chart, incorporate it into a table, display it alongside metrics, or perhaps have it visible within the legend? Any further details or visual aids you can provide, such as sketches or screenshots, would be valuable in ensuring that we understand what you are trying to achieve.
Sure @Everton Colling.
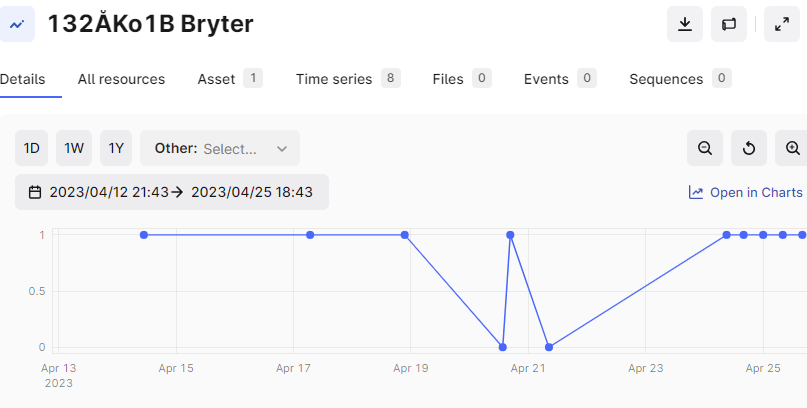
Take this time series, which is a 2bit time series, indicating the position of a switch. Where the values are most often 0 or 1 (on or off), and occasionally 2 or 3 (indicating in-between-states).
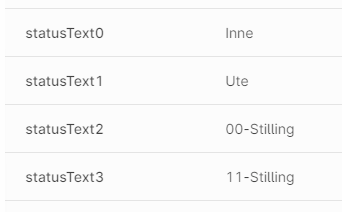
The time series has metadata fields indicating the meaning of each value.
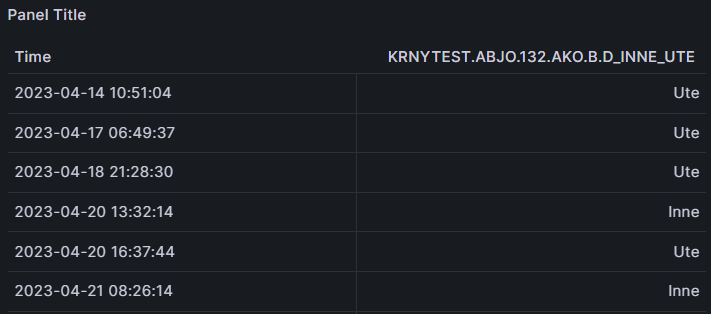
In Grafana it would be useful to display these as a table, or event-list (not Cognite-style events with a duration, but instantaneous events).
Something like this:
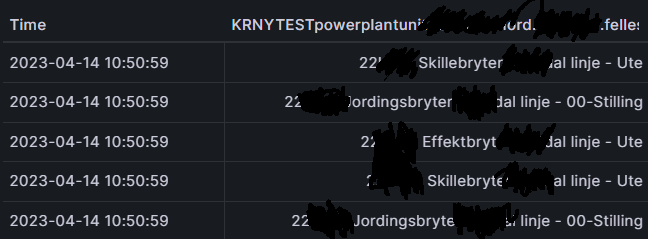
Or perhaps better, something like this, with the name of the time series and its status text:
These examples are realised by creating new string time series - which duplicates data from the underlying time series, and is unable to handle multiple datapoints with the same timestamp.
My question is how I can extract the “statusText” metadata fields in Grafana, which would let me create such event lists without first creating a string time series.
I hope this was clarifying :)
Thanks for sharing more details of your use case Kristian!
I see what you’re trying to visualize is what we are calling internally machine states, utilizing metadata from time series to convert numerical values into meaningful state descriptions. Currently, transforming data in this specific way directly in Grafana is not straightforward given the existing functionalities of the CDF Grafana data source plugin.
We understand that our current offerings of numerical and string time series does not allow to store the full context of machine states like the ones you described. I’ll point this to my colleague @Glen Sykes, who is the Product Manager responsible for Time Series. Glen has been gathering requirements for a potential extension that would enable a more fitting representation of machine states within CDF.
In the meantime, while we work on a more integrated solution, there are a couple of alternative approaches you might consider:
Custom Scripting within Grafana: If you're comfortable with scripting, you might explore using a custom panel that enables transforming the source data using javascript. Then you can map these integer values to their descriptive counterparts. One example of such panel is the Apache ECharts Panel for Grafana.
Utilizing External Processing: As you correctly mentioned in your example, it’s possible to preprocess your data outside Grafana to map the numerical values to their descriptive states before feeding this information into Grafana. This can be stored in string timeseries, but also events or data models (if the number of data points is not substantial) where you can display the data as a table.
While these suggestions might not be as simple as having native support within the CDF Grafana data source, they could provide a temporary solution to achieve your visualization goals, while we don’t have proper support for machine states in Time Series.
Thanks for the tag @Everton Colling, and I’m pleased to be able to say that having native support for machine states in our Time Series service is in our 2024 roadmap, and we expect to be able to commence work on this feature in the second half of 2024.
For what it’s worth, in my experience the number of states a machine can be in is rarely more than say 10, so creating a type in your data model where you can store the mappings between the numeric representation and the state name, could be a solution in the meantime.
[...]
Custom Scripting within Grafana: If you're comfortable with scripting, you might explore using a custom panel that enables transforming the source data using javascript. Then you can map these integer values to their descriptive counterparts. One example of such panel is the Apache ECharts Panel for Grafana.
<...]
Thanks for the feedback @Everton Colling and @Glen Sykes . The machine states feature sounds like it might be what we need to address this.
I wonder, if I create a custom panel, I would still need to use another data source than the Cognite data source for Grafana to retrieve the metadata from time series, no? I don’t suppose it would be good practice, or even possible, to use the CDF Javascript SDK within an Apache ECharts Panel to connect directly from the panel to CDF.
Or is perhaps data models the way to go to retrieve the time series metadata in Grafana using the Cognite datasource plugin? We haven’t started using data models in CDF yet, but plan to in the near future. We have 11.000 machine state type time series, and I’m not sure yet about the amount of work it would be to set up a model which collects the metadata for all of them.
To help you get started and to make sure my suggestion holds, I’ve taken your example and created a dummy time series to mimic your use case, as below:
On Grafana, I can now fetch this timeseries using either the Time series search tab or the Time series custom query tab as below:
The only way that you can expose the metadata information from the time series into the plot data is by using the dynamic Label functionality. Notice how I’m mapping the relevant statusText from metadata to the label. The full code for my label is:
let dataPoints = sData.map((d, i) => =sTime[i], d.toFixed(2)])
//forward fill last state to the end of the chart var lastKnownYValue = dataPointsPdataPoints.length - 1]h1]; var maxXValue = data.timeRange.to._d.getTime(); dataPoints.push(.maxXValue, lastKnownYValue]);
// get the mapping from the metadata var jsonString = s.name.replace(/'/g, '"'); var machineMap = JSON.parse(jsonString.replace(/(\d+):/g, '"$1":'));
Note how the mapping we created using the Label is made available using the name property of the series.
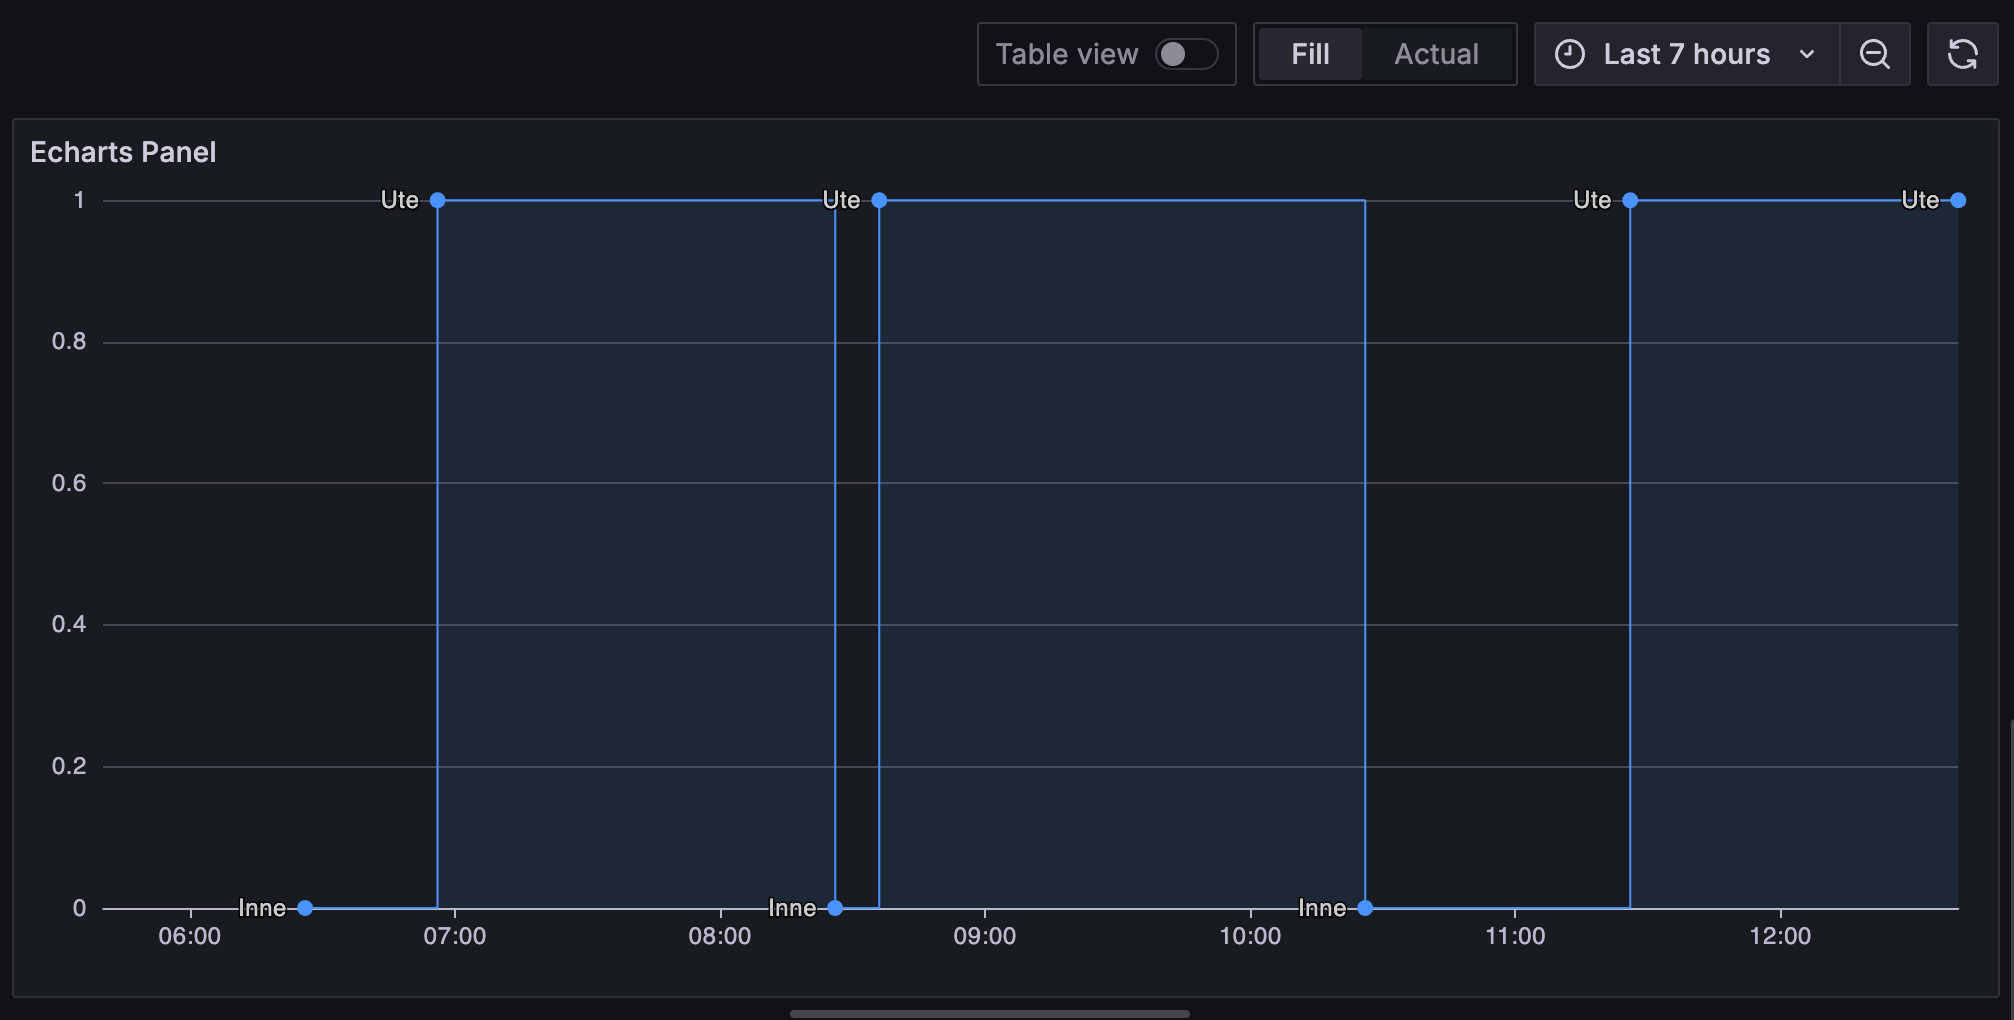
This will produce the following chart:
Now it’s up to you to evaluate if that would be a good enough solution for the time being. Hopefully later this year when machine states are properly represented in CDF, we can have a better solution out of the box.
@Everton Colling What an impressively detailed walkthrough. This will definitely help me set up a workaround while we wait for native support of machine states in CDF.