Solved

Charts: Save calculation performed on all data points

  • 11 December 2023
  • 5 replies
  • 70 views

Badge

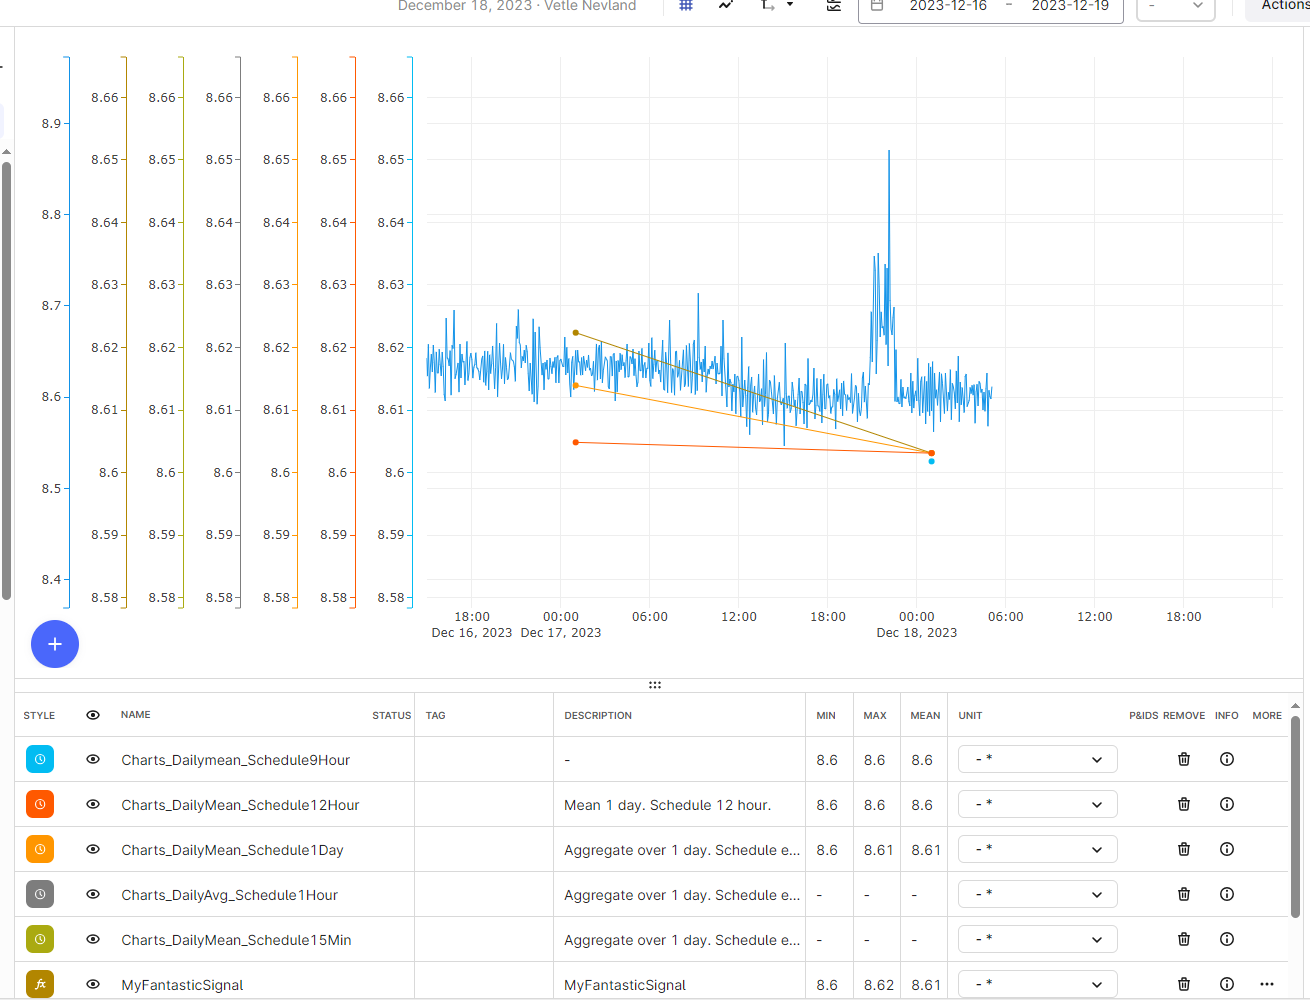
I want to create a new time series in CDF based on a calculation on another time series. This can be done by saving the calculation in a schedule. But I would like to run a calculation on the full input signal (which may span multiple years back in time), but it seems like the scheduling limit is 30 days (can anyone verify?). 

Is it possible to run a single calculation in Charts (spanning the entire period) and save the result to a Time Series object without going by a schedule? Or do I need to use the Python SDK for this purpose?

Thanks in advance!

Vetle.

icon

Best answer by Neringa Altanaite 12 December 2023, 15:26

View original

5 replies

Hi Vetle!

Thanks for the question!

Currently Charts allow to save a calculation as a time series to CDF only by using a schedule. It does not run on historical data as it performs your defined calculation on the selected schedule. The current limit for schedule frequency is 30 days. 

Assuming you have selected to run schedule every day. The first time time schedule will be running, it will be looking at the time interval from (time_scheduled_was_created -1 day) to time_scheduled_was_created. The second time schedule will be running it will be performing your calculation on the time interval from time_scheduled_was_created to time_scheduled_was_created +1day


Badge

Thanks for the answer, @Neringa Altanaite.

A follow-up question: Is it possible to perform aggregations on date-specific properties? I would like to run a calculation on a source signal and then calculate the daily average of the result, i.e., the average for each date, not from time_scheduled_was_created to (time_scheduled_was_created + 1 day). Any functionality for this?

Thanks again.

Hi! 

If you want to perform calculation on already scheduled time series, you could import the new time series to Charts and perform calculation on it. We do have a function to calculate aggregates that you can use for your calculation. https://indsl.docs.cognite.com/resample.html#resampling-to-granularity-default

You can also create a calculation that performs aggregation on the time window that you have selected in charts and then schedule it, however, you will not be able to specify to run calculation on data points from midnight to midnight or similar.  

@Arun Arunachalam @Knut Vidvei I think this is a very good use case that we should look at :) 

Badge

@Neringa Altanaite @Knut Vidvei @Arun Arunachalam 

As I see it, scheduled calculations of aggregates are not consistent in Charts. As of now, the aggregated result for each aggregation period depends on the saved schedule of your calculation. The attached image tries to illustrate the issue. I have set up five different schedules for the same aggregated calculation (daily mean of blue input signal). The schedules were created at around 12 pm, 18 Dec. The input signal only has no values from 5 am, 18 Dec and onwards. Thus, the 1 hour and 15 minute schedules don’t provide any daily average value for 18 Dec. The 12 hour and 1 day schedules both cover all datapoints of 18th Dec when called at 12 pm, 18 Dec, and thus gives the same daily average value, while the 9 hour schedule gives a different value since it only covers around 75% of datapoints for this date. The same principle explains the deviated result at 17 Dec for the 12 hour and 1 day schedules. Optimally, I think it should be possible to assemble the aggregated result for each scheduled call that covers the aggregated period (i.e., for the 9 hour schedule assemble the previous result from 12am-3am with the current result from 3am-12pm), so that the aggregated result for the 9 hour schedule equals the aggregated result for the 12 hour / 1 day schedule. Does Charts provide such a functionality for assembling results over the aggregated period? If not, I think this would be a great addition to expand possible use cases of Cognite Charts :)

Thanks in advance!


Hi Vetle! 

Sorry for late reply.  I see that the problem is caused by performing calculation on the time intervals that cannot be specified by the user. This is very interesting feature request and I will let our PM @Arun Arunachalam know about it! :) 

Reply