Cognite Data Fusion: Ability to show single values from a trend in Industrial Canvas

Related products: Industrial Canvas

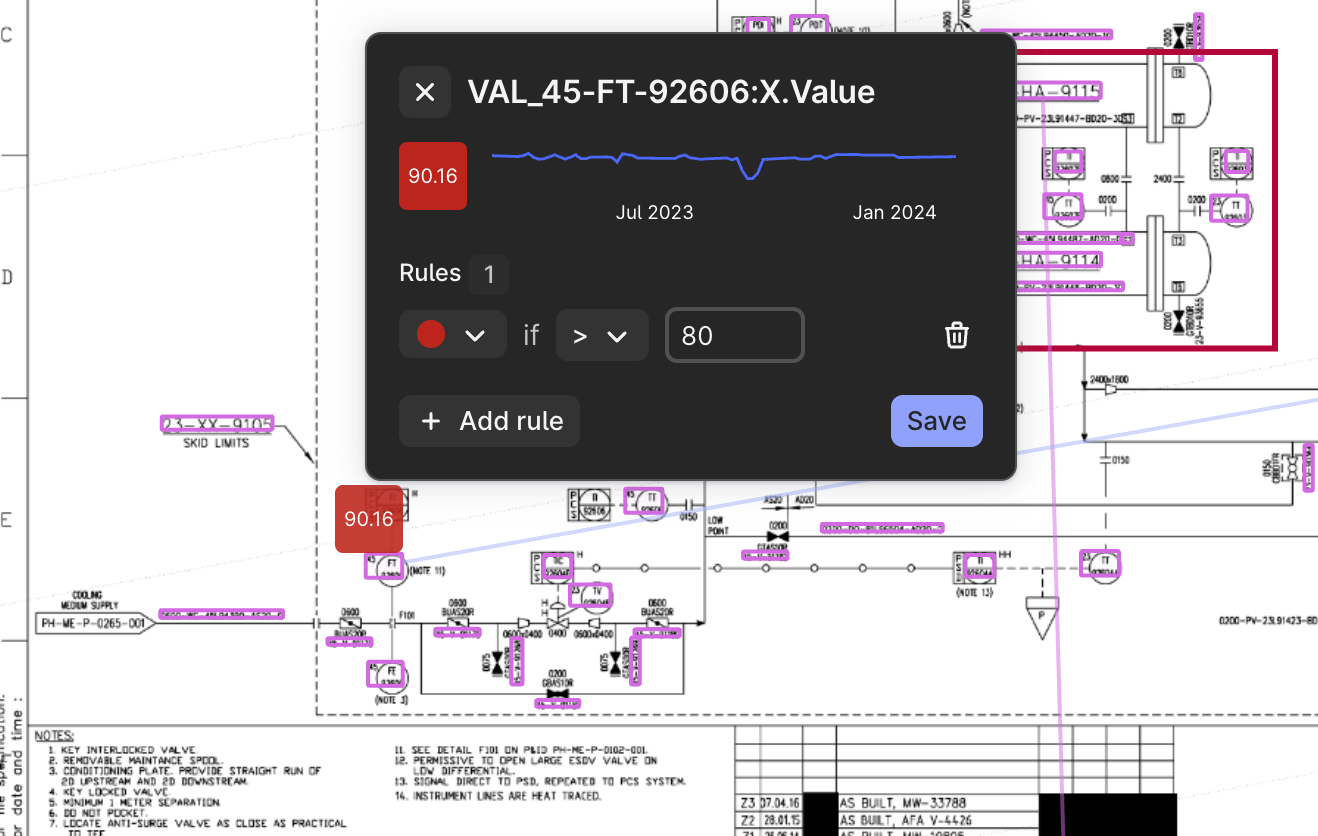
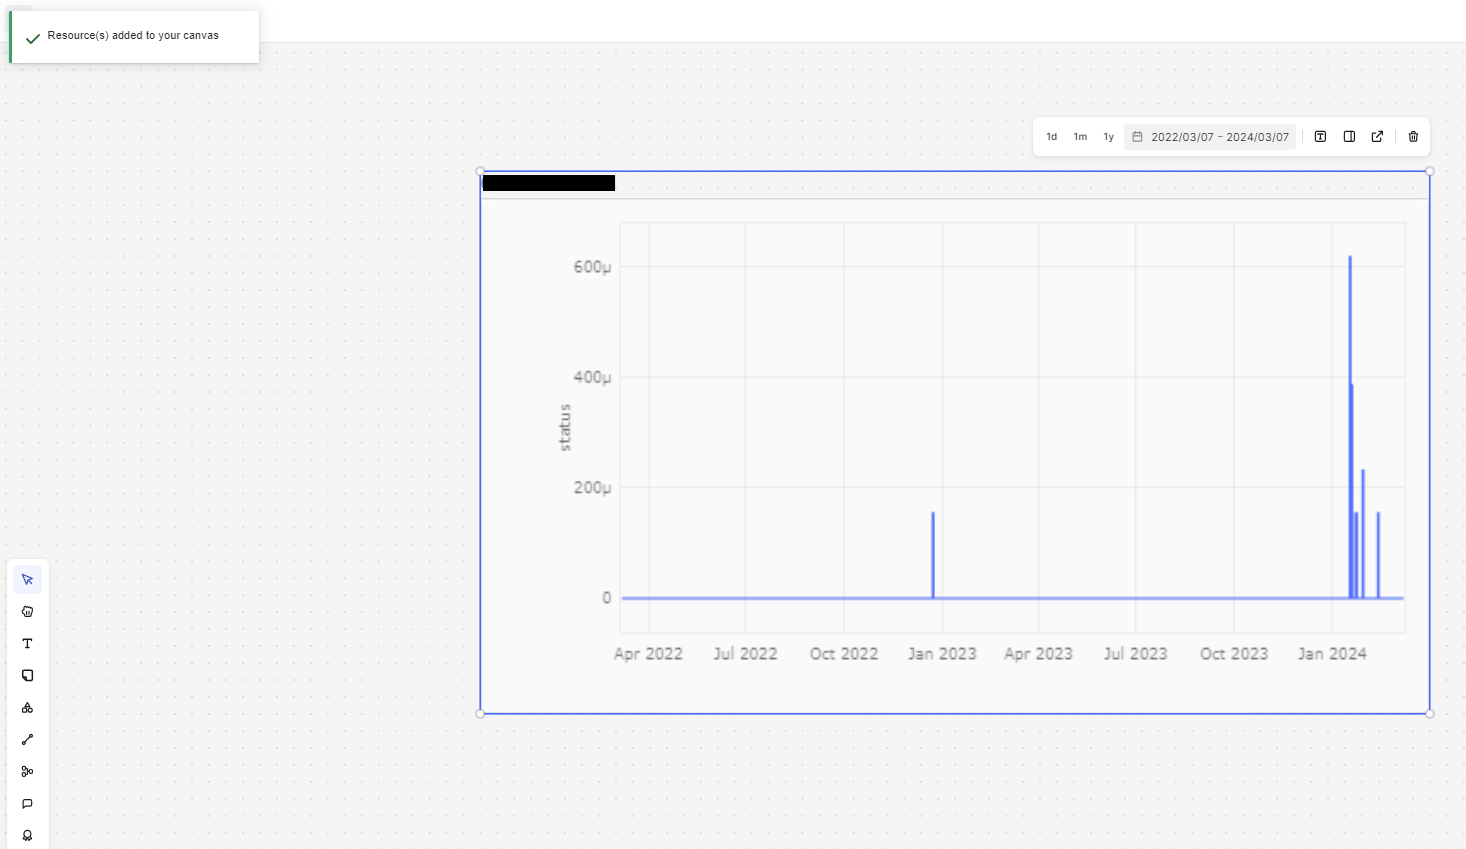
On behalf of Celanese super users:

I would like the ability to highlight and showcase only the most current and live value from a time series tag on my canvas. This would be similar functionality to what is possible via Pi process books or PowerBi dashboards. Currently, canvas only allows you to visualize the full trend of a time series tag at different time intervals. It would be great to have the option to swap between a single data point and the trend.

Hi @crgomez13 ,

This feature is already available in Industrial Canvas by pinning a time series it will show the latest data point (the data being refreshed each 30 sec).

Please let me know if you have more feedback on this feature.


Hello @Andreea Oprea!


Is this only possible when you have a file to get the timeseries from? I tried adding the timeseries straight to canvas and could not find this option that you showed.

For the use case I am trying to solve, I need around 30 values from timeseries in different equipment, that means many different files. Having to find the files to get the values would not give a good user experience.


Hi @dalvaniamp,

Thank you for the feedback, now it’s more clear what user experience would help you.
Just one more question: You need the latest value for all those 30 time series? Or you need the latest 30 data points for each time series? 

We are already working on some enhanced capabilities that would help this experience. 

Thank you,
Andreea.


Hello Andreea!


I need the latest value from all 30 time series for this use case in particular.