Check the
documentation
Check the
documentation Ask the
Community
Ask the
Community Take a look
at
Academy
Take a look
at
Academy Cognite
Status
Page
Cognite
Status
Page Contact
Cognite Support
Contact
Cognite Support

The ability to see the linked P&IDs to a timeseries (via the asset) is very helpful as it allows us to also see other assets/timeseries that are connected to a specific tag.
However we noticed that the processed SVG files from the P&IDs (pdf) are also included in the list. These are not clickable and causes some confusion at times. The list is also not arranged alphabetically, if it was, it would have caused the PDF P&IDs to appear on top.
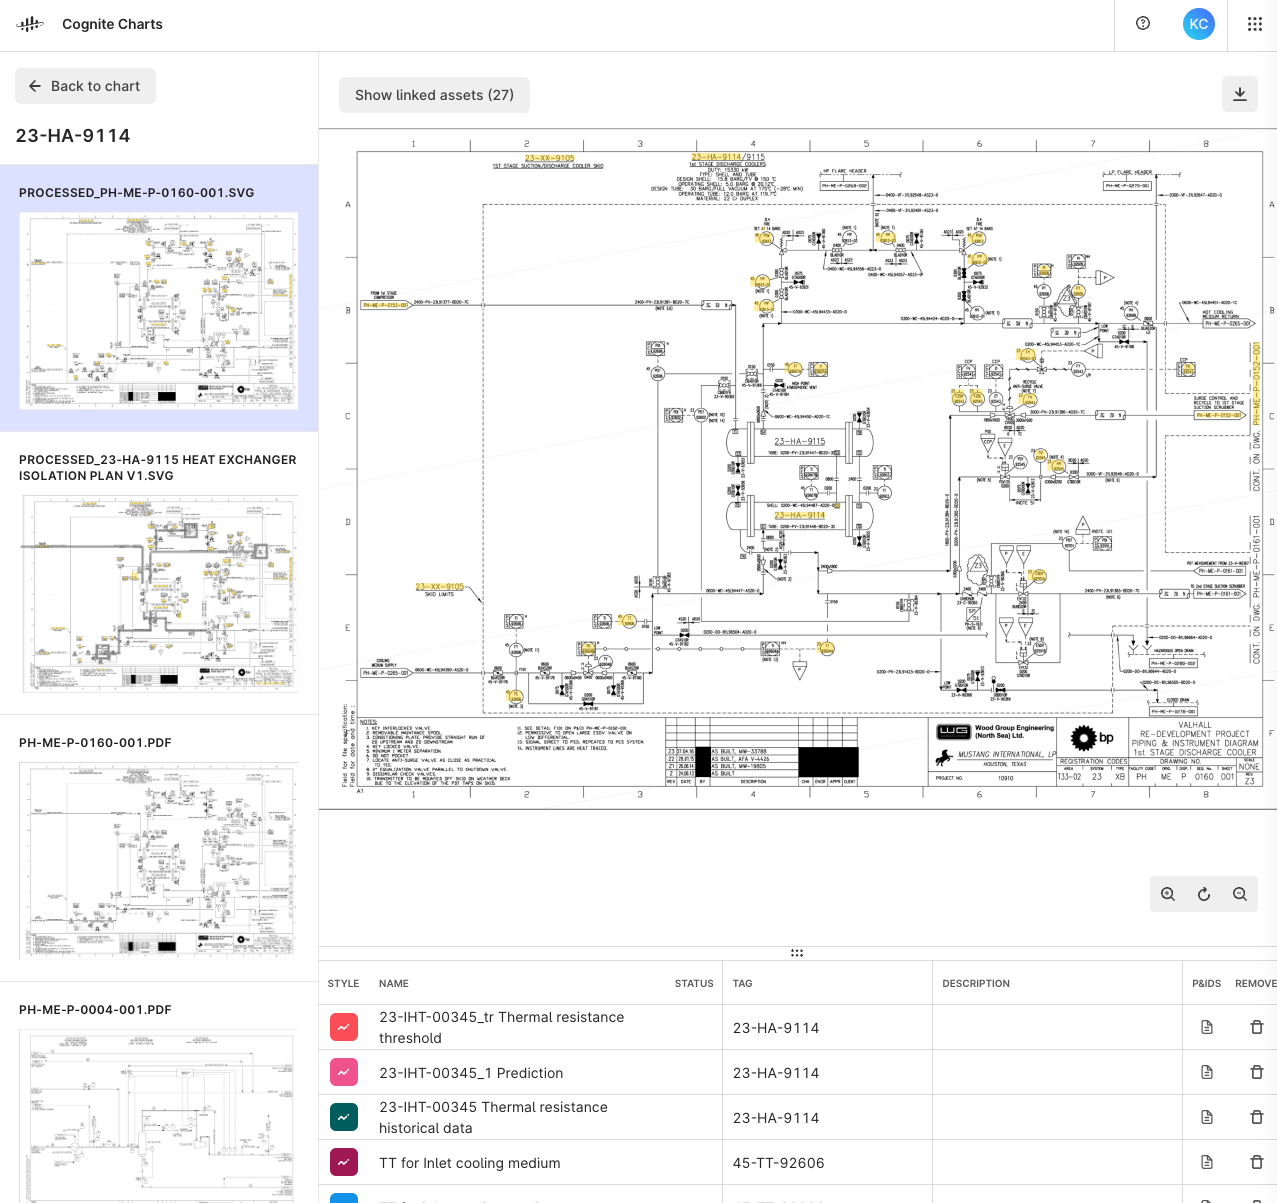
In summary, we would just like to see the “clickable” PDF files to be the first one on the list. But if there is a way to sort or filter through the list of files, especially for assets that appears in/linked to multiple files.