

 Check the
documentation
Check the
documentation Ask the
Community
Ask the
Community Take a look
at
Academy
Take a look
at
Academy Cognite
Status
Page
Cognite
Status
Page Contact
Cognite Support
Contact
Cognite Support
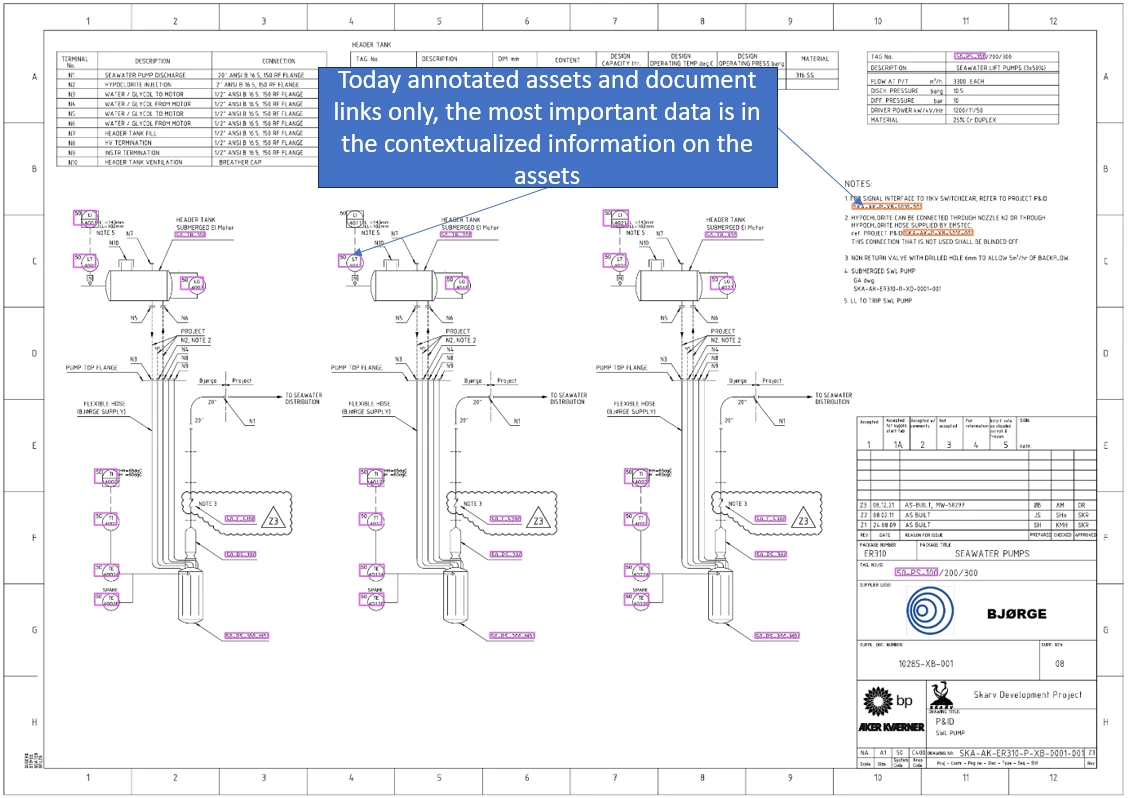
- Today to much information is cumbersome to visualize, when the information is easily available.
- Annotated P&ID is a perfect example.
- Assets are recognized on a document, but actually the assets are only the placeholder for the valuable information, like live data, metadata, events and all the other stuff we have in CDF.
- Users are interested in being able to visualize this information on a technical workface instead of in a 3d model.
- ITs a visualization based on context with regards to flow, P&Id, Electrics etc which can be automatically populated based on the underlaying contextualized information in CDF


Hey Øystein!
Thank you for the elaborate feedback! We appreciate it a lot!
I agree that a P&ID with some pink boxes is not particularly useful in and of itself. This is only an entry point to finding the data related to that equipment or sensor.
Canvas already supports live data visualization with conditional coloring based on the most recent data point from time series. You can get to this by clicking the pink annotation on an equipment, and “pin” any time series related to it. Here’s an example:
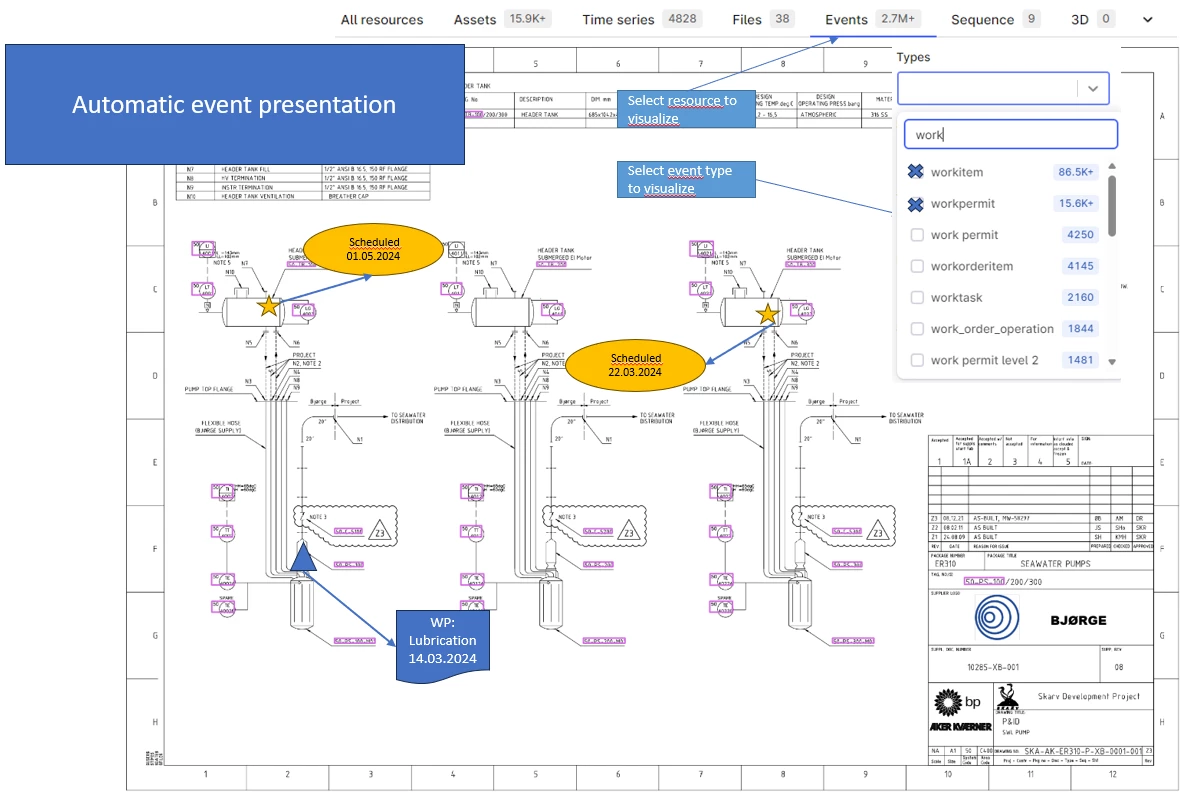
We do not support anything like that for events just yet. It would be great learn more about what types of events you’d like to see there, and how. Among the first things we’ll add support for overlaying on documents are work orders and notifications, useful in context of work preparation.
In addition to being able to open simple time series charts, we’ve also recently added support for adding charts created in Cognite Charts onto the canvas. Both of these are interactive. I recommend trying to build a chart in Charts, and then click “Open in Canvas” in the top right corner of the Charts app. You can also find existing charts by clicking the “+ Add data” button, and then look for the “Charts” tab, like so:
Lastly, we’re also working on more advanced conditional formatting, to allow colors of lines and shapes to change based on live data from time series or metadata of assets and similar. We’d love to get your feedback on what we’re working on, so if you’re keen, we can schedule a session with you to show you a sneak peek of what we’ve got, and get your initial impression and feedback!
I’m heading out for Easter today. Happy Easter to you when that time comes!
This is great thanks! I still think it is cumbersome to manually add all of this information when one could give users the option to automatic change between the different layers of information, but this is huge step in the right direction!