

 Check the
documentation
Check the
documentation Ask the
Community
Ask the
Community Take a look
at
Academy
Take a look
at
Academy Cognite
Status
Page
Cognite
Status
Page Contact
Cognite Support
Contact
Cognite Support

IN SHORT
This article aims to showcase how you can get value from your sensor data by continuously monitoring the health condition of a rotating equipment. We will present details of a health monitoring method that is being used by multiple operators across the globe to monitor their high value equipment.
Failure of a rotating equipment, such as a turbine, pump or a compressor can cost an operator millions of dollars in revenue and repair. These assets generally contain a large number of sensors that capture the vibration, pressure, temperature and other useful metrics in a live data stream. When the data coming from the sensors go through appropriate analytics, it can correctly categorize the “health risk level” of an equipment. Operators can monitor a live dashboard that continuously updates the asset risks or subscribe to alerts that send a notification whenever there is concern in the operations.
METHOD
The asset health risk is based on the percentage of anomalies in the incoming data. The anomalies are identified as data points outside the historical normal operating range of individual sensors. A bottom up approach is used to assign the final asset risk based on multiple sensors. There are three steps in the method of computing health risk:
-
Step 1 (Calculate Safe Limits): The safe/reasonable operating limits of all the individual sensors are established through analyzing the historical data, from time periods where the equipment was operating “normally”.
-
Step 2 (Anomaly detection): Incoming sensor data is evaluated for anomalies that cross the normal operating range of each sensor.
-
Step 3 (Health Meter): The percentage of anomalous data points over a short duration is used as a basis to assign a health score to the equipment. The calculated percentage of anomalies in the worst performing sensor is mapped to a risk level and assigned to the asset. This calculation is performed frequently to update the assessment from the latest data points.
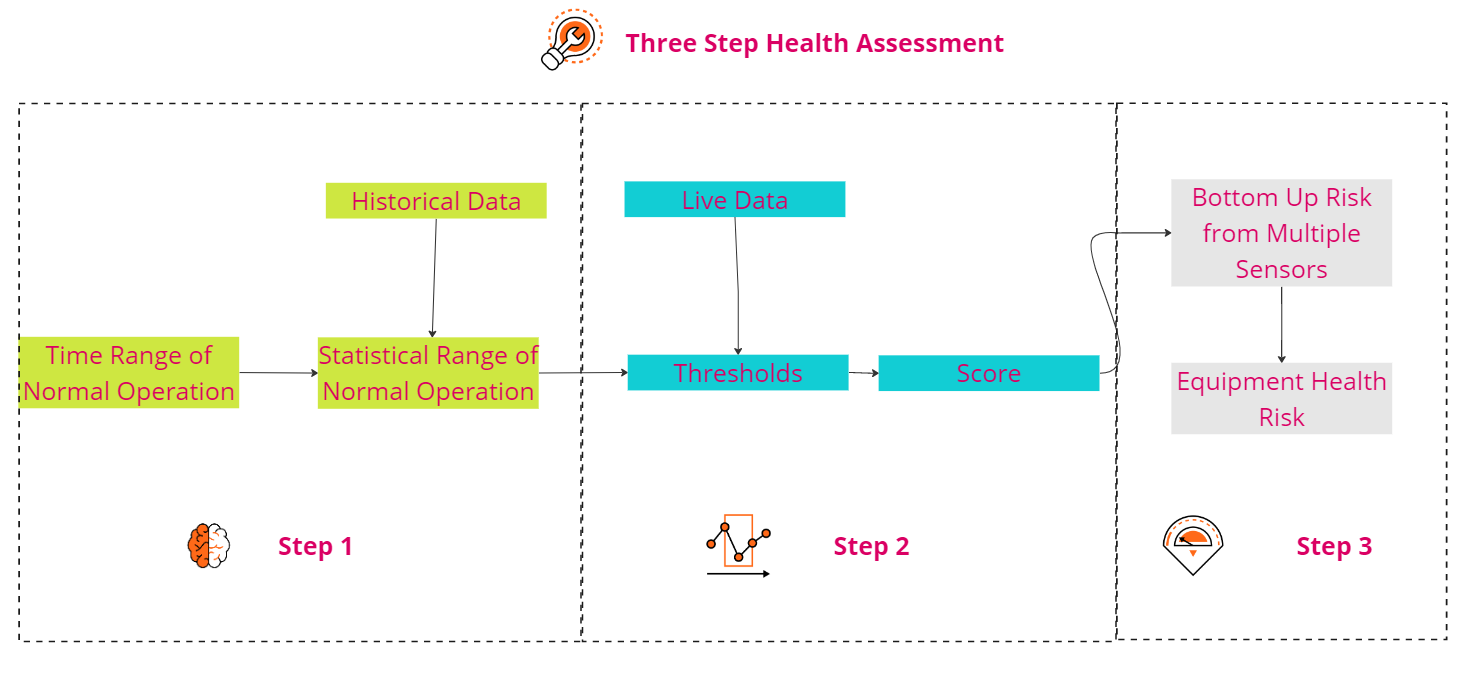
The bottom up approach for the final health score assigns the risk associated with the worst performing sensor to the asset. Each part of the equipment will have the risk associated with its worst performing sensor. This process ensures that the specific part of the asset that needs attention is captured in every health assessment calculation. Asset hierarchies in Cognite Data Fusion (CDF) are particularly useful to visualize the risks in different parts of the equipment.
RESULTS
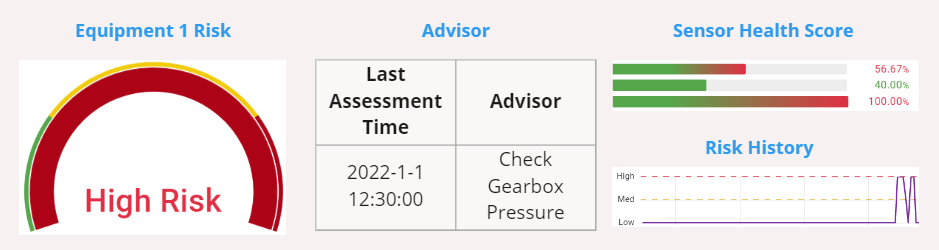
The asset health calculations are run in CDF using Cognite Functions and the results are written back to CDF. The output is generally displayed using PowerBI, Grafana or Charts connectors. Cognite apps can be configured to create alerts from the calculated risk levels which can be consumed in the form of emails. Additionally, asset risks can be shown in Infield, enabling easy access to latest analytics results.
Scalability is a key success criteria for a data analytics solution. A solution developed for one rotating equipment should easily scale to many assets of the same class. Cognite Templates/Flexible data Modeling is used to scale the solution to many assets automatically!
SUMMARY
Digital integrity management is essential for sustainability and optimal performance. A big advantage of this approach is that it is generalizable and configurable in a very short time. In addition, this method:
-
Does not need prior failure data to build the health monitoring model
-
Points to the exact part of the system that is performing worst
-
Intuitively detects anomalies that translates to a health score
-
Scales through the data model, only required input from the customer is the tag names and the normal operating ranges
We'd love to hear your thoughts on what applications you have that can make data do more for you using this method. Do you already have sensor-data from pumps and/or turbines, and is scaling your asset health monitoring solution something you'd like to do? Let us know in the comments 🙂.