Check the
documentation
Check the
documentation Ask the
Community
Ask the
Community Take a look
at
Academy
Take a look
at
Academy Cognite
Status
Page
Cognite
Status
Page Contact
Cognite Support
Contact
Cognite Support


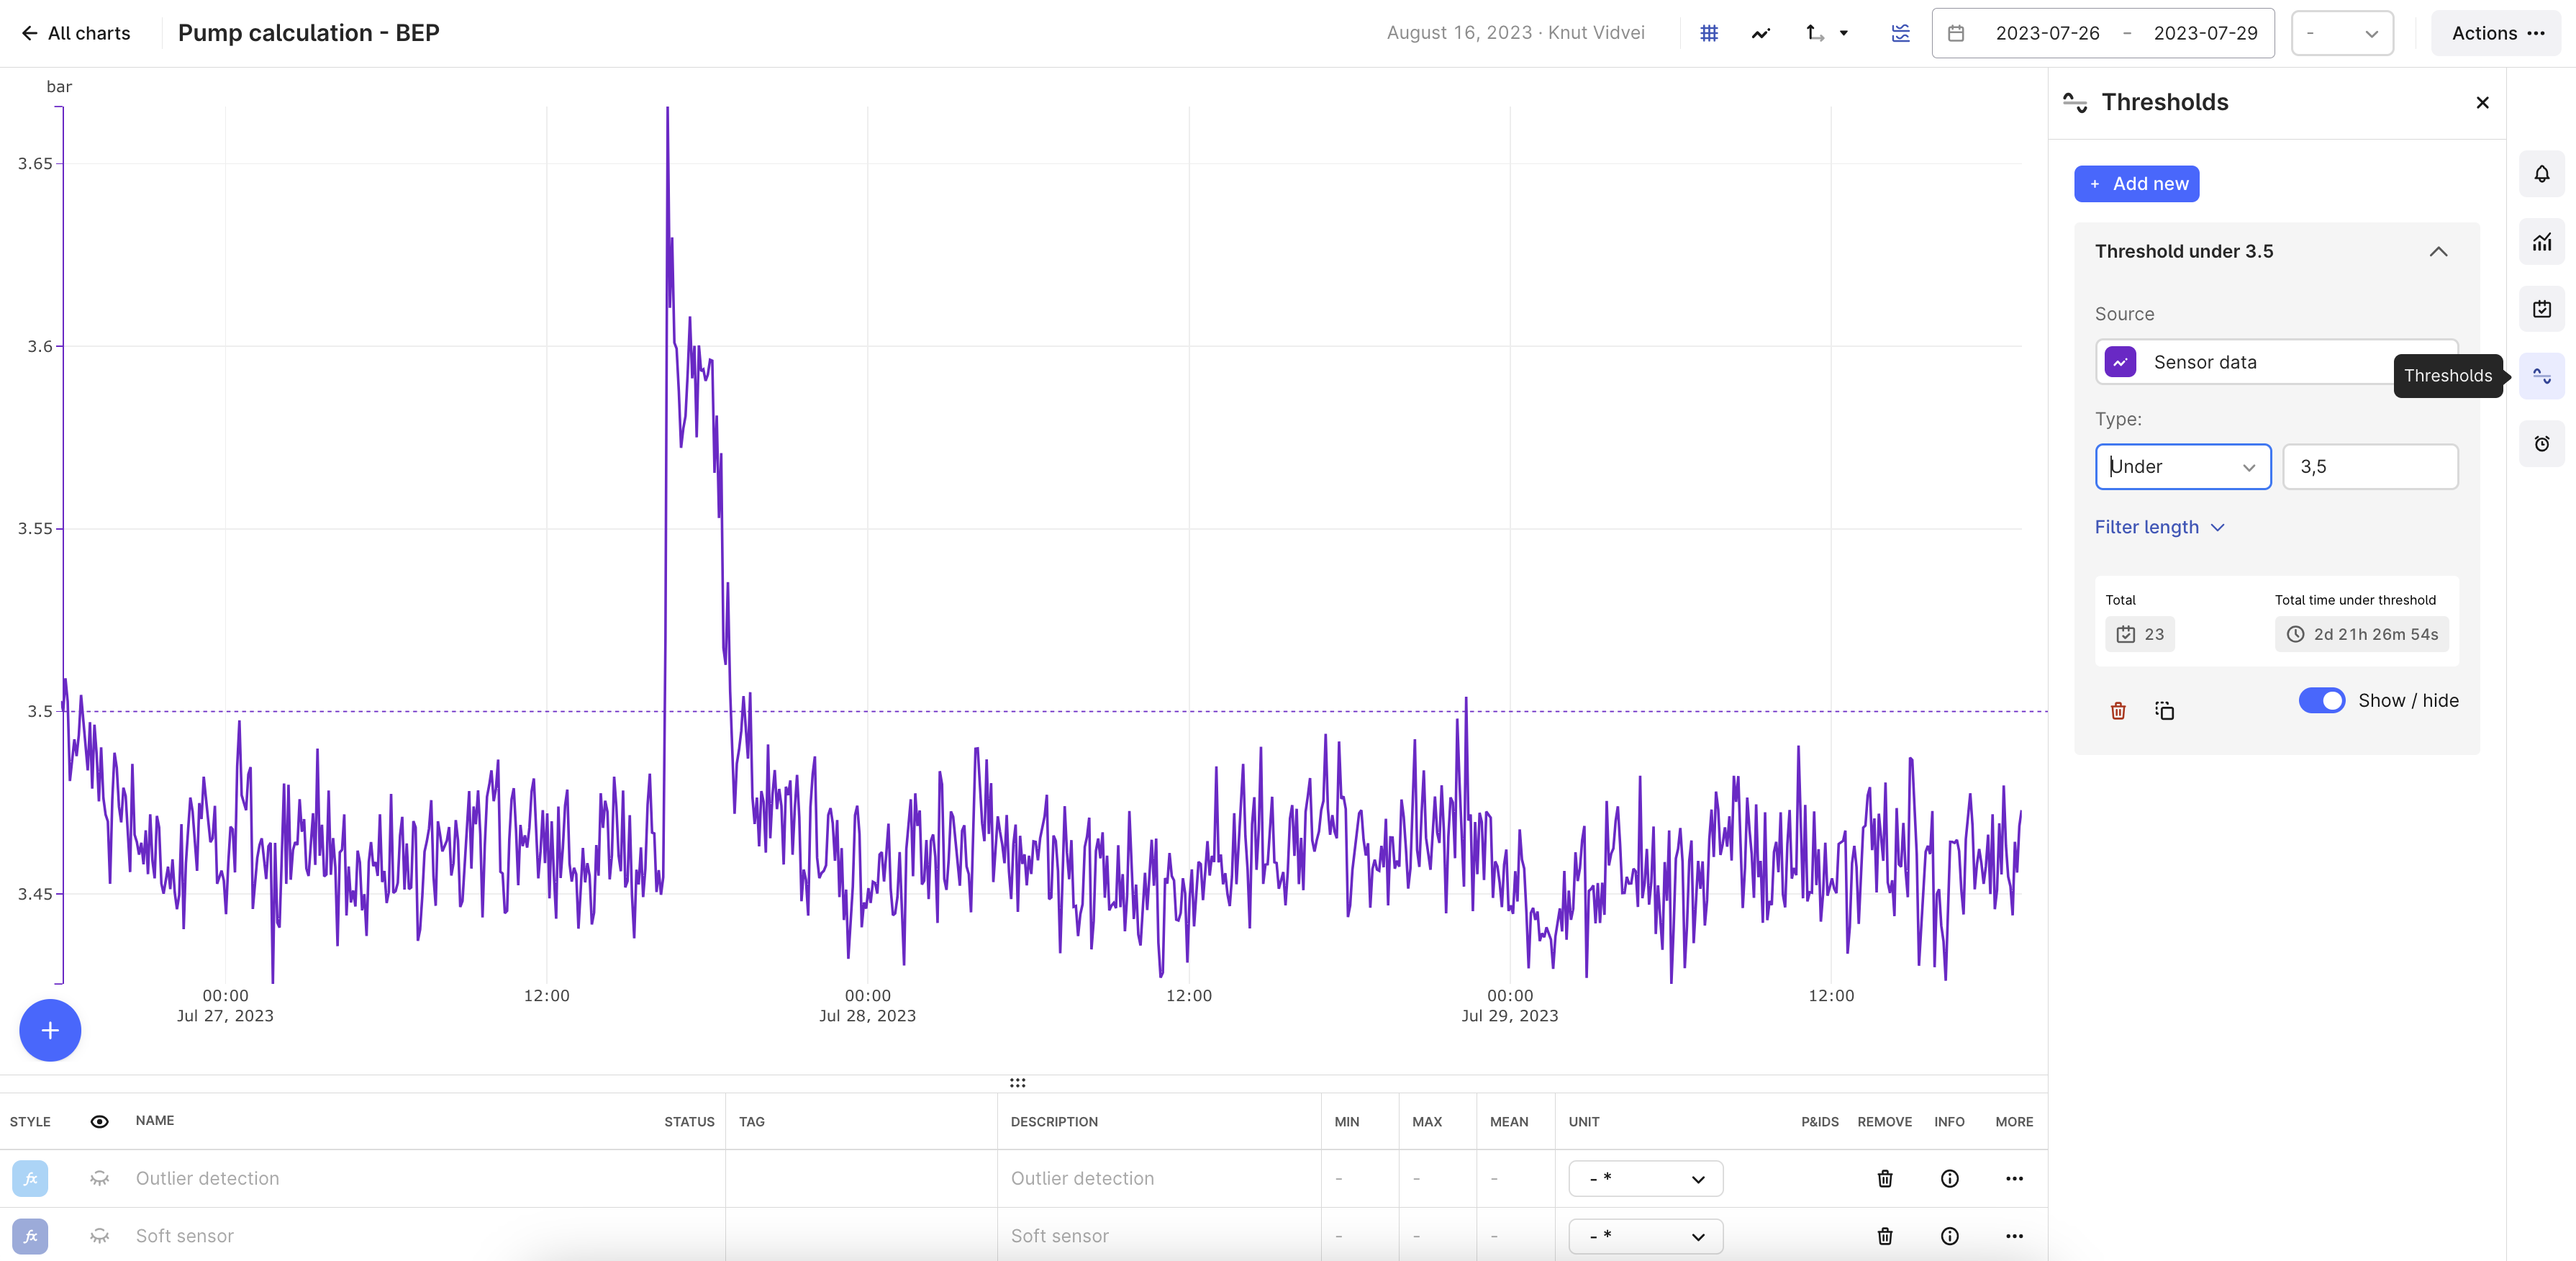
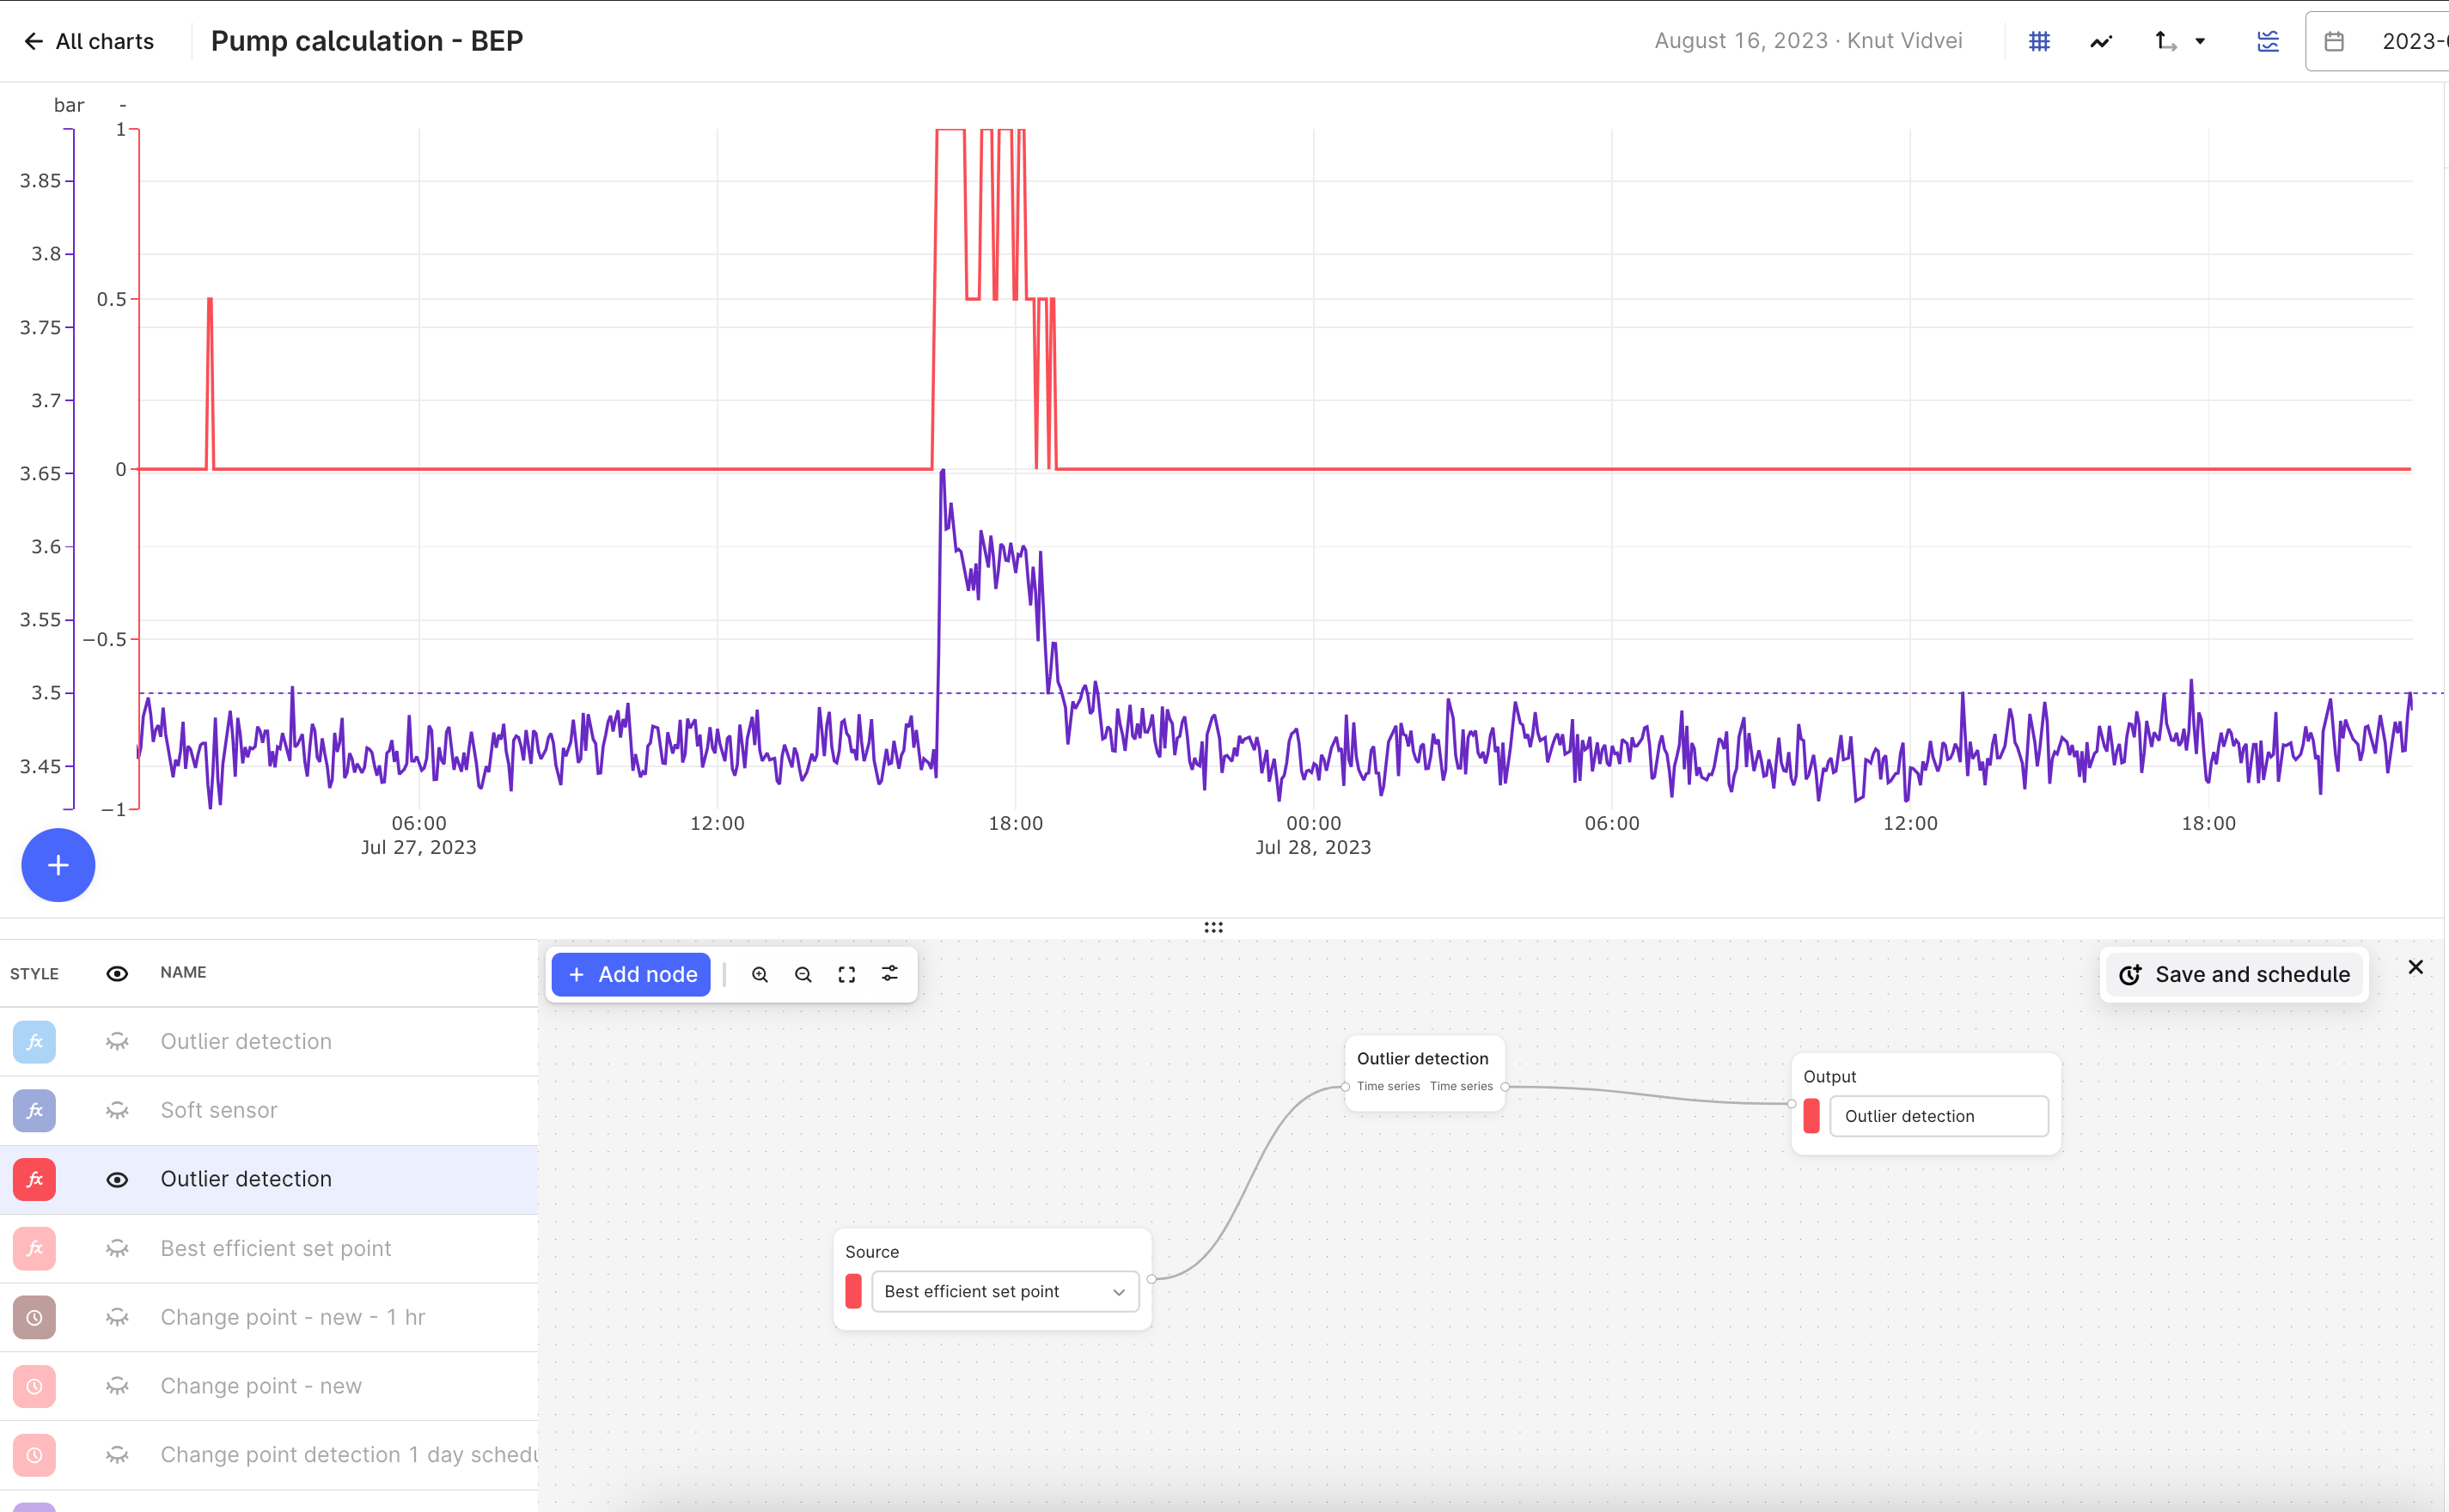
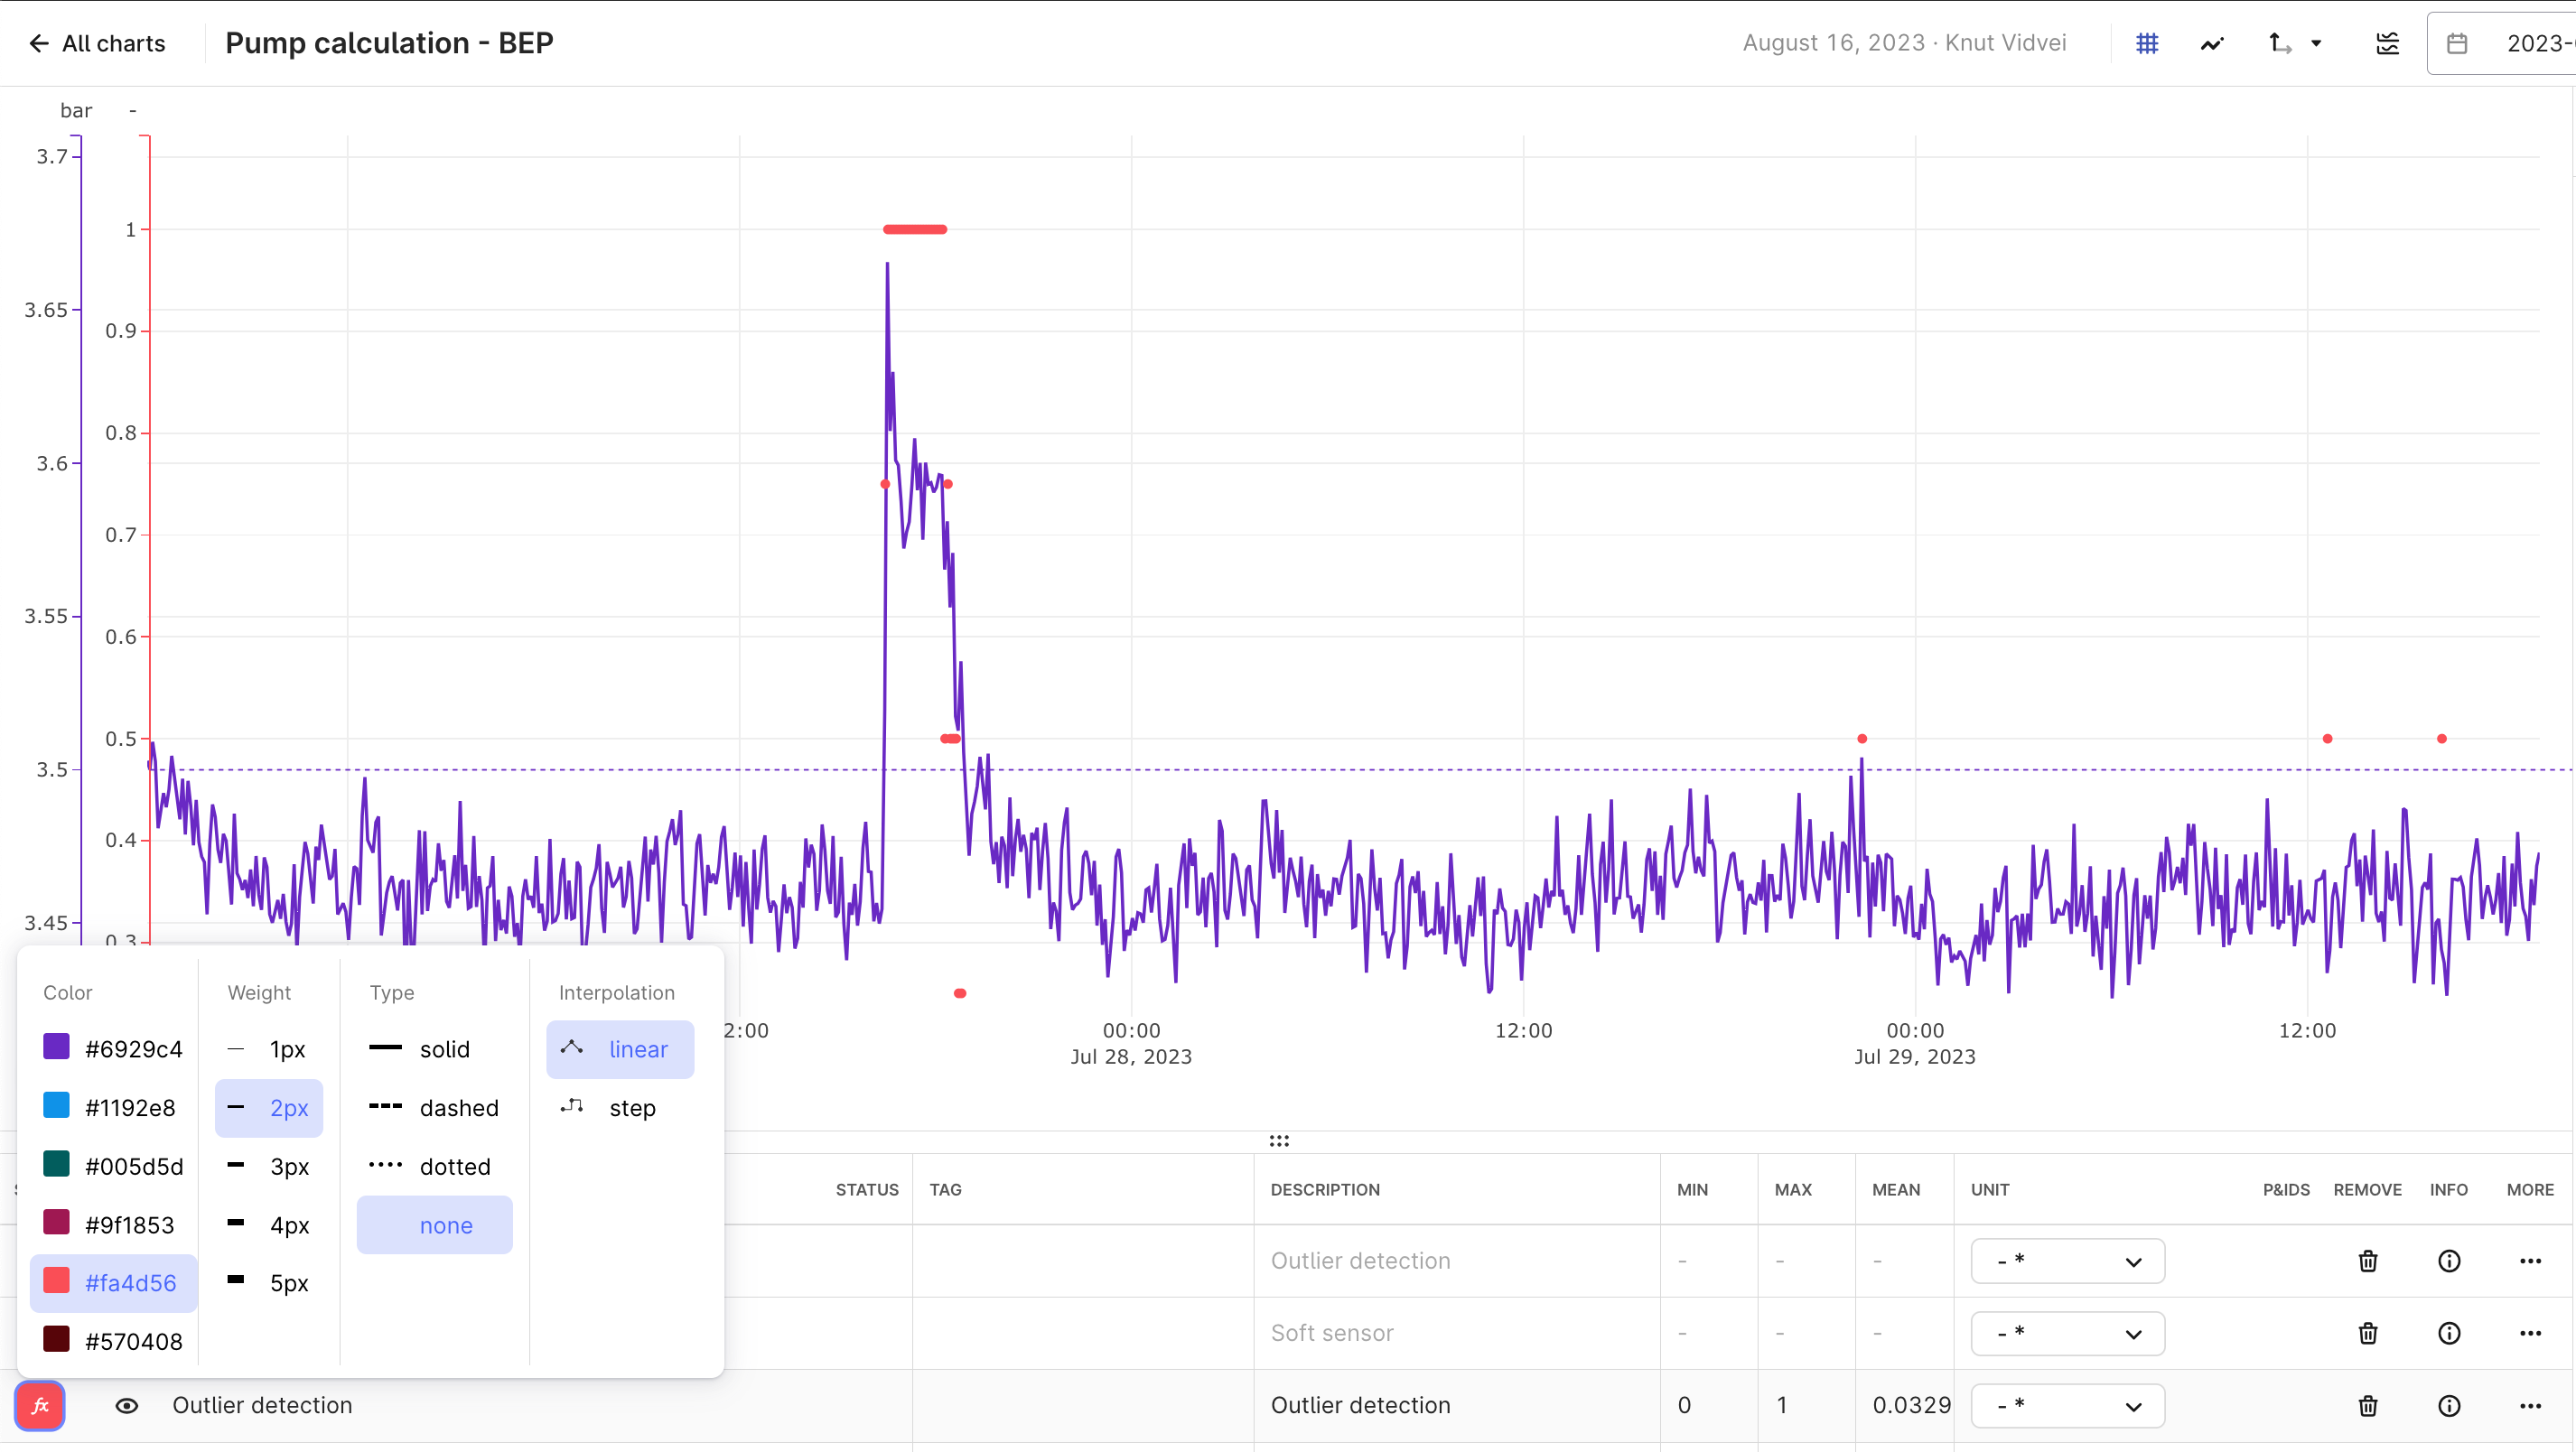
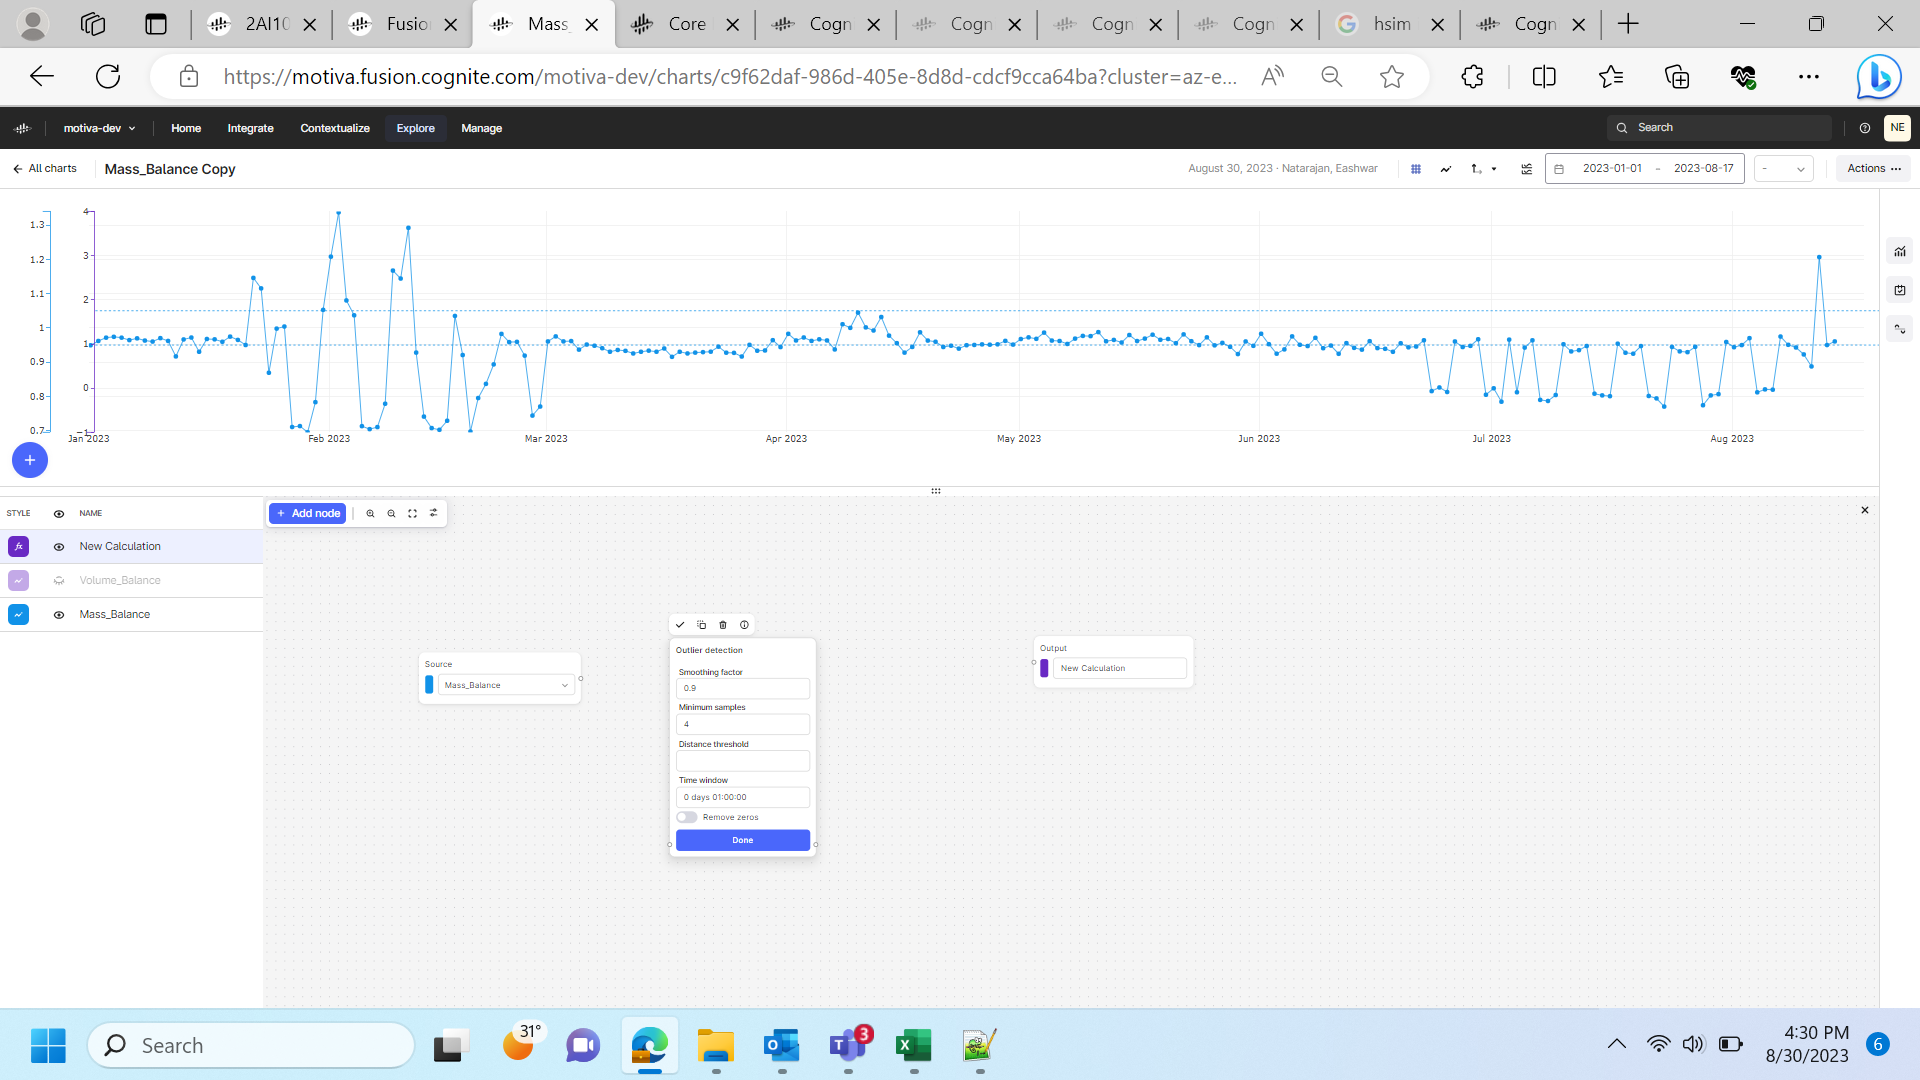
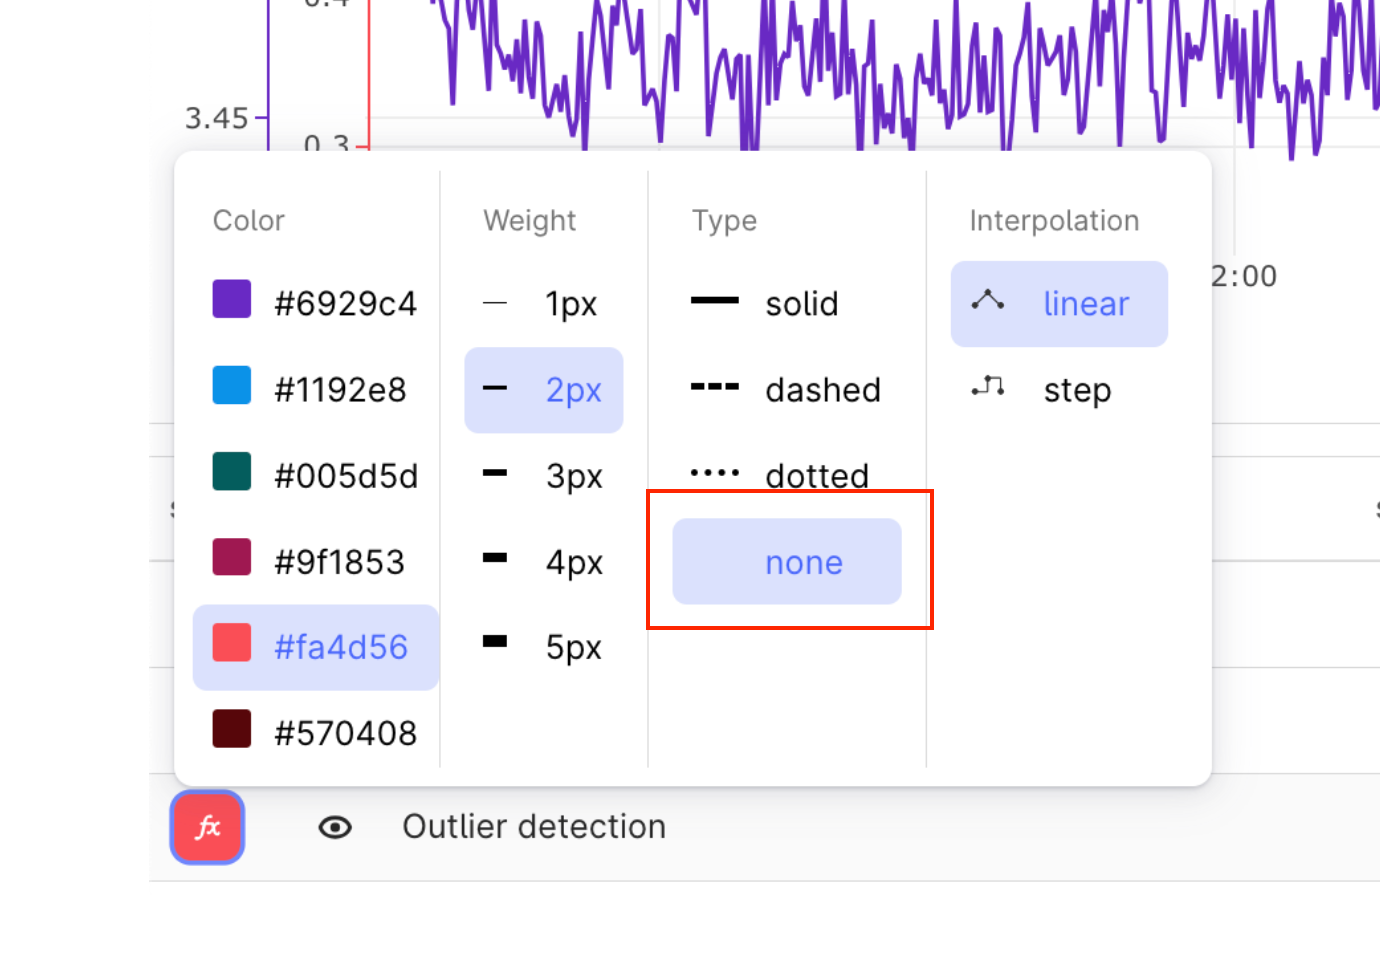
I have a CDF chart that is showing some output based on the timeseries associated with. I want to flag the points on the chart that are beyond some threshold. (say anything >0.5 and <-0.5 is abnormal and need to be flagged off in the chart) IS there a way to show that in the CDF charts visualization.
Best answer by Knut Vidvei
View original