Solved

Cognite Charts: Cumulative Sum Calculations

  • 21 November 2022
  • 5 replies
  • 102 views

Userlevel 1

On behalf of Celanese Clear Lake Utilities super user

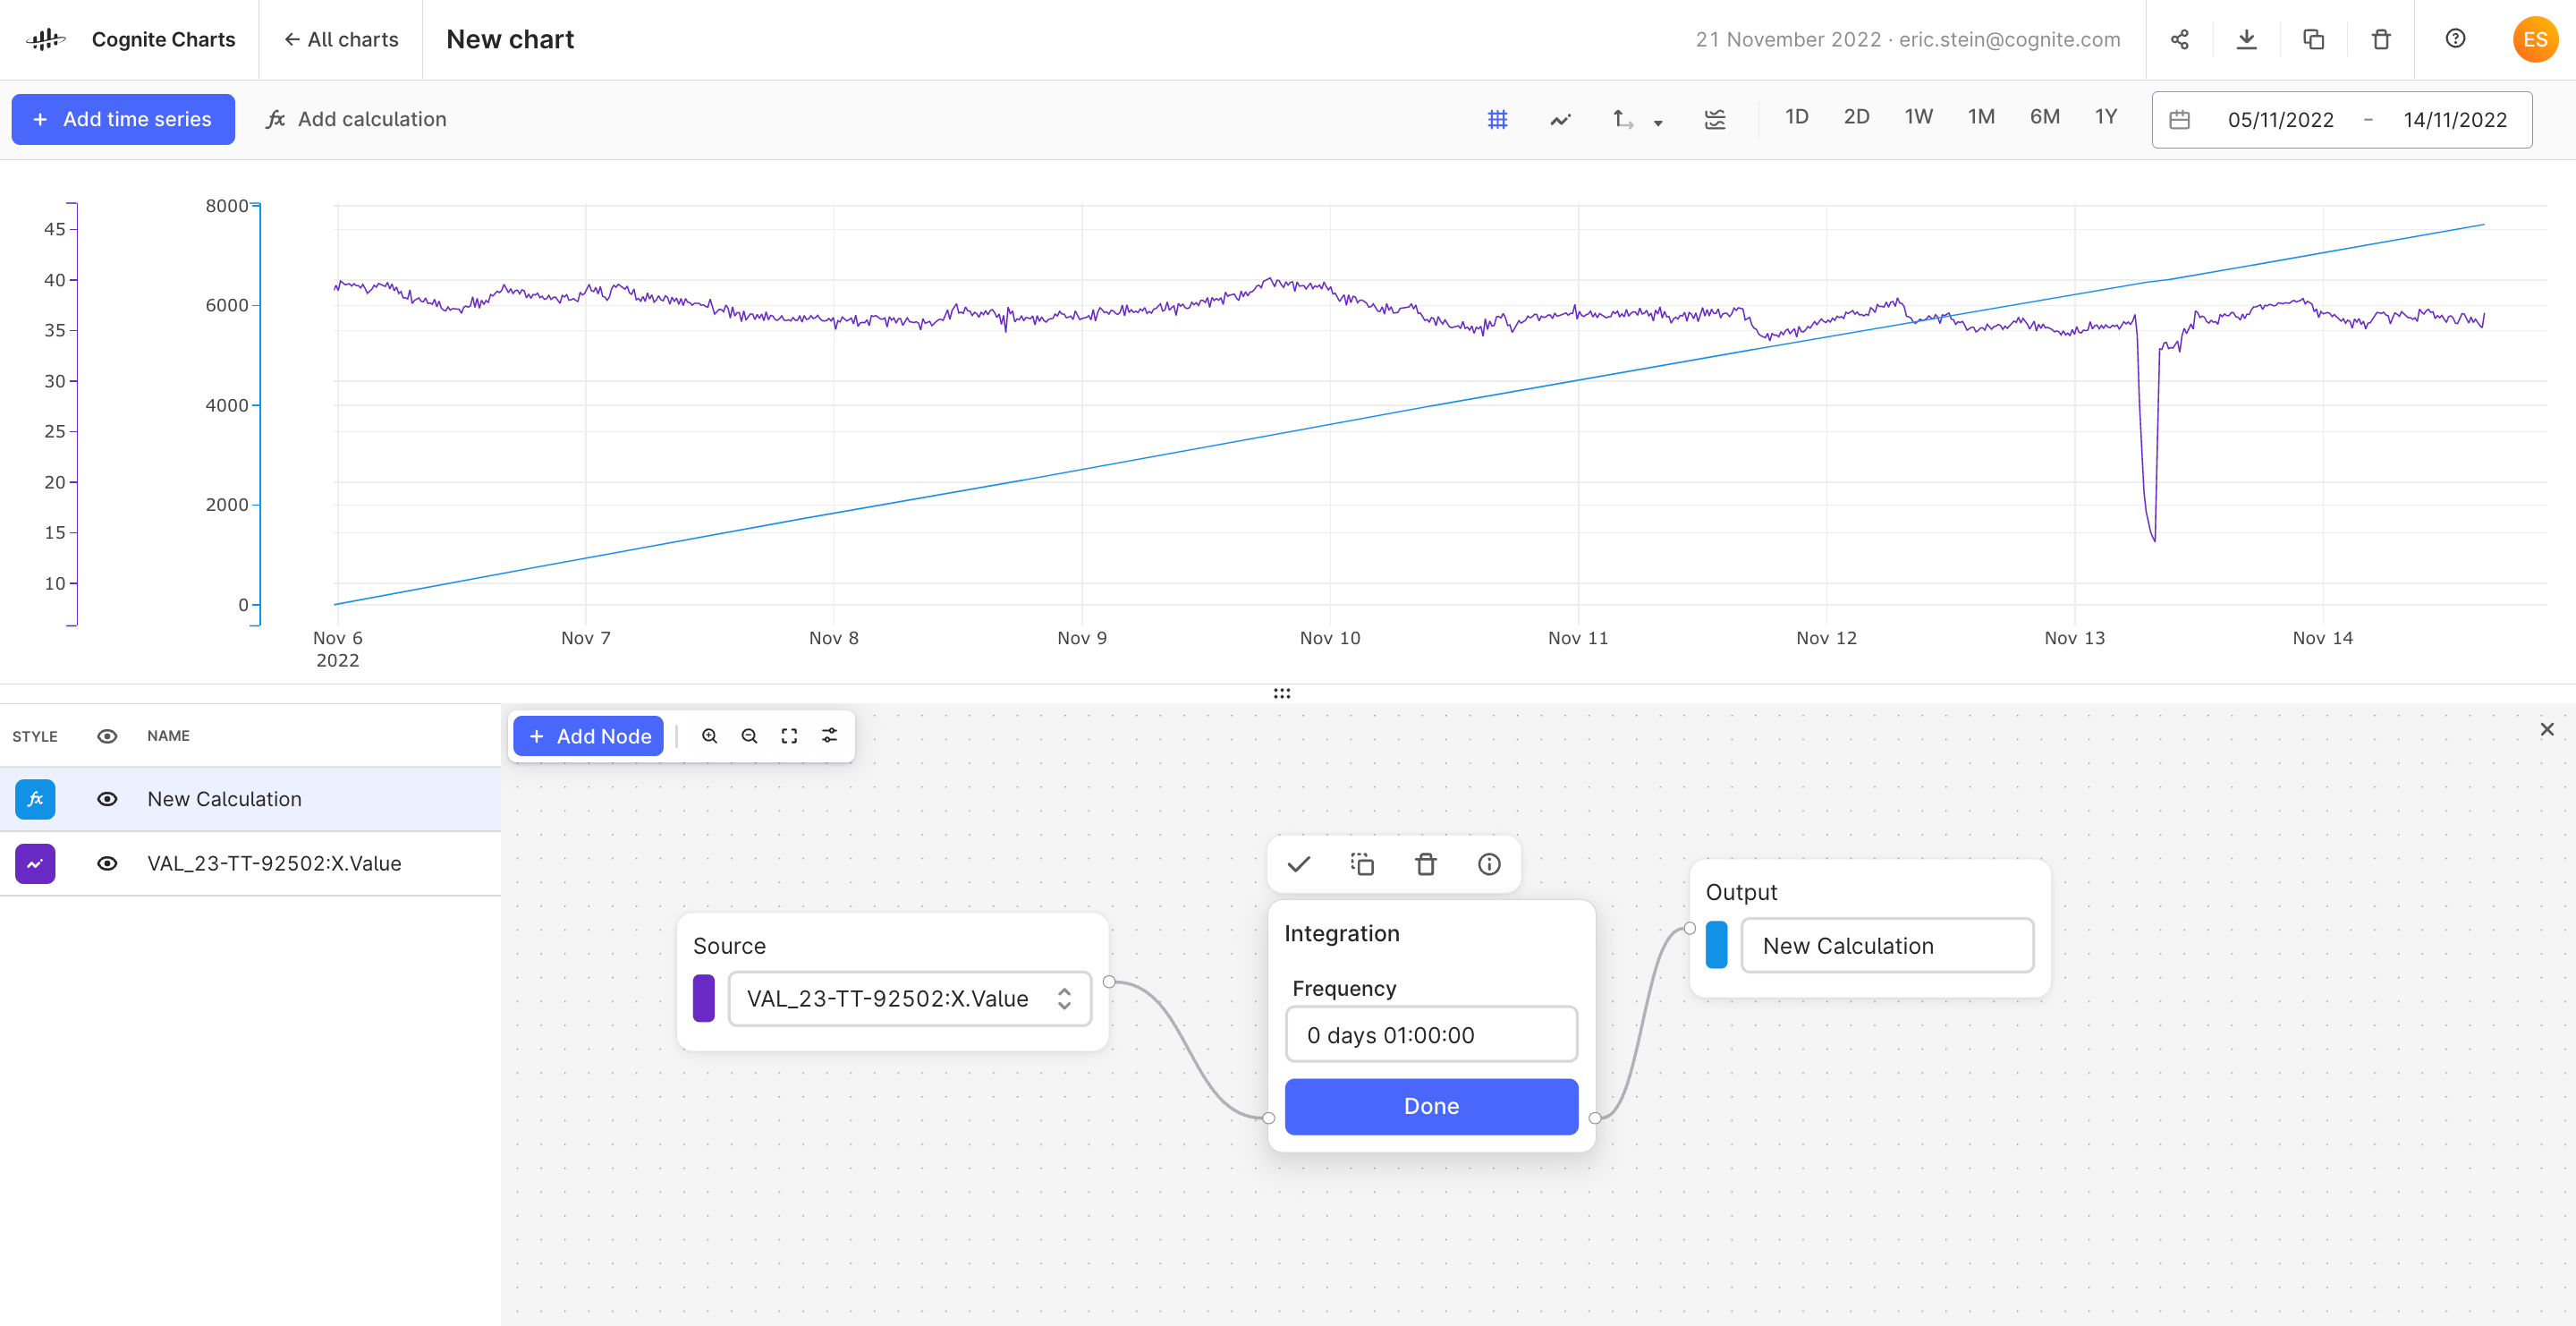
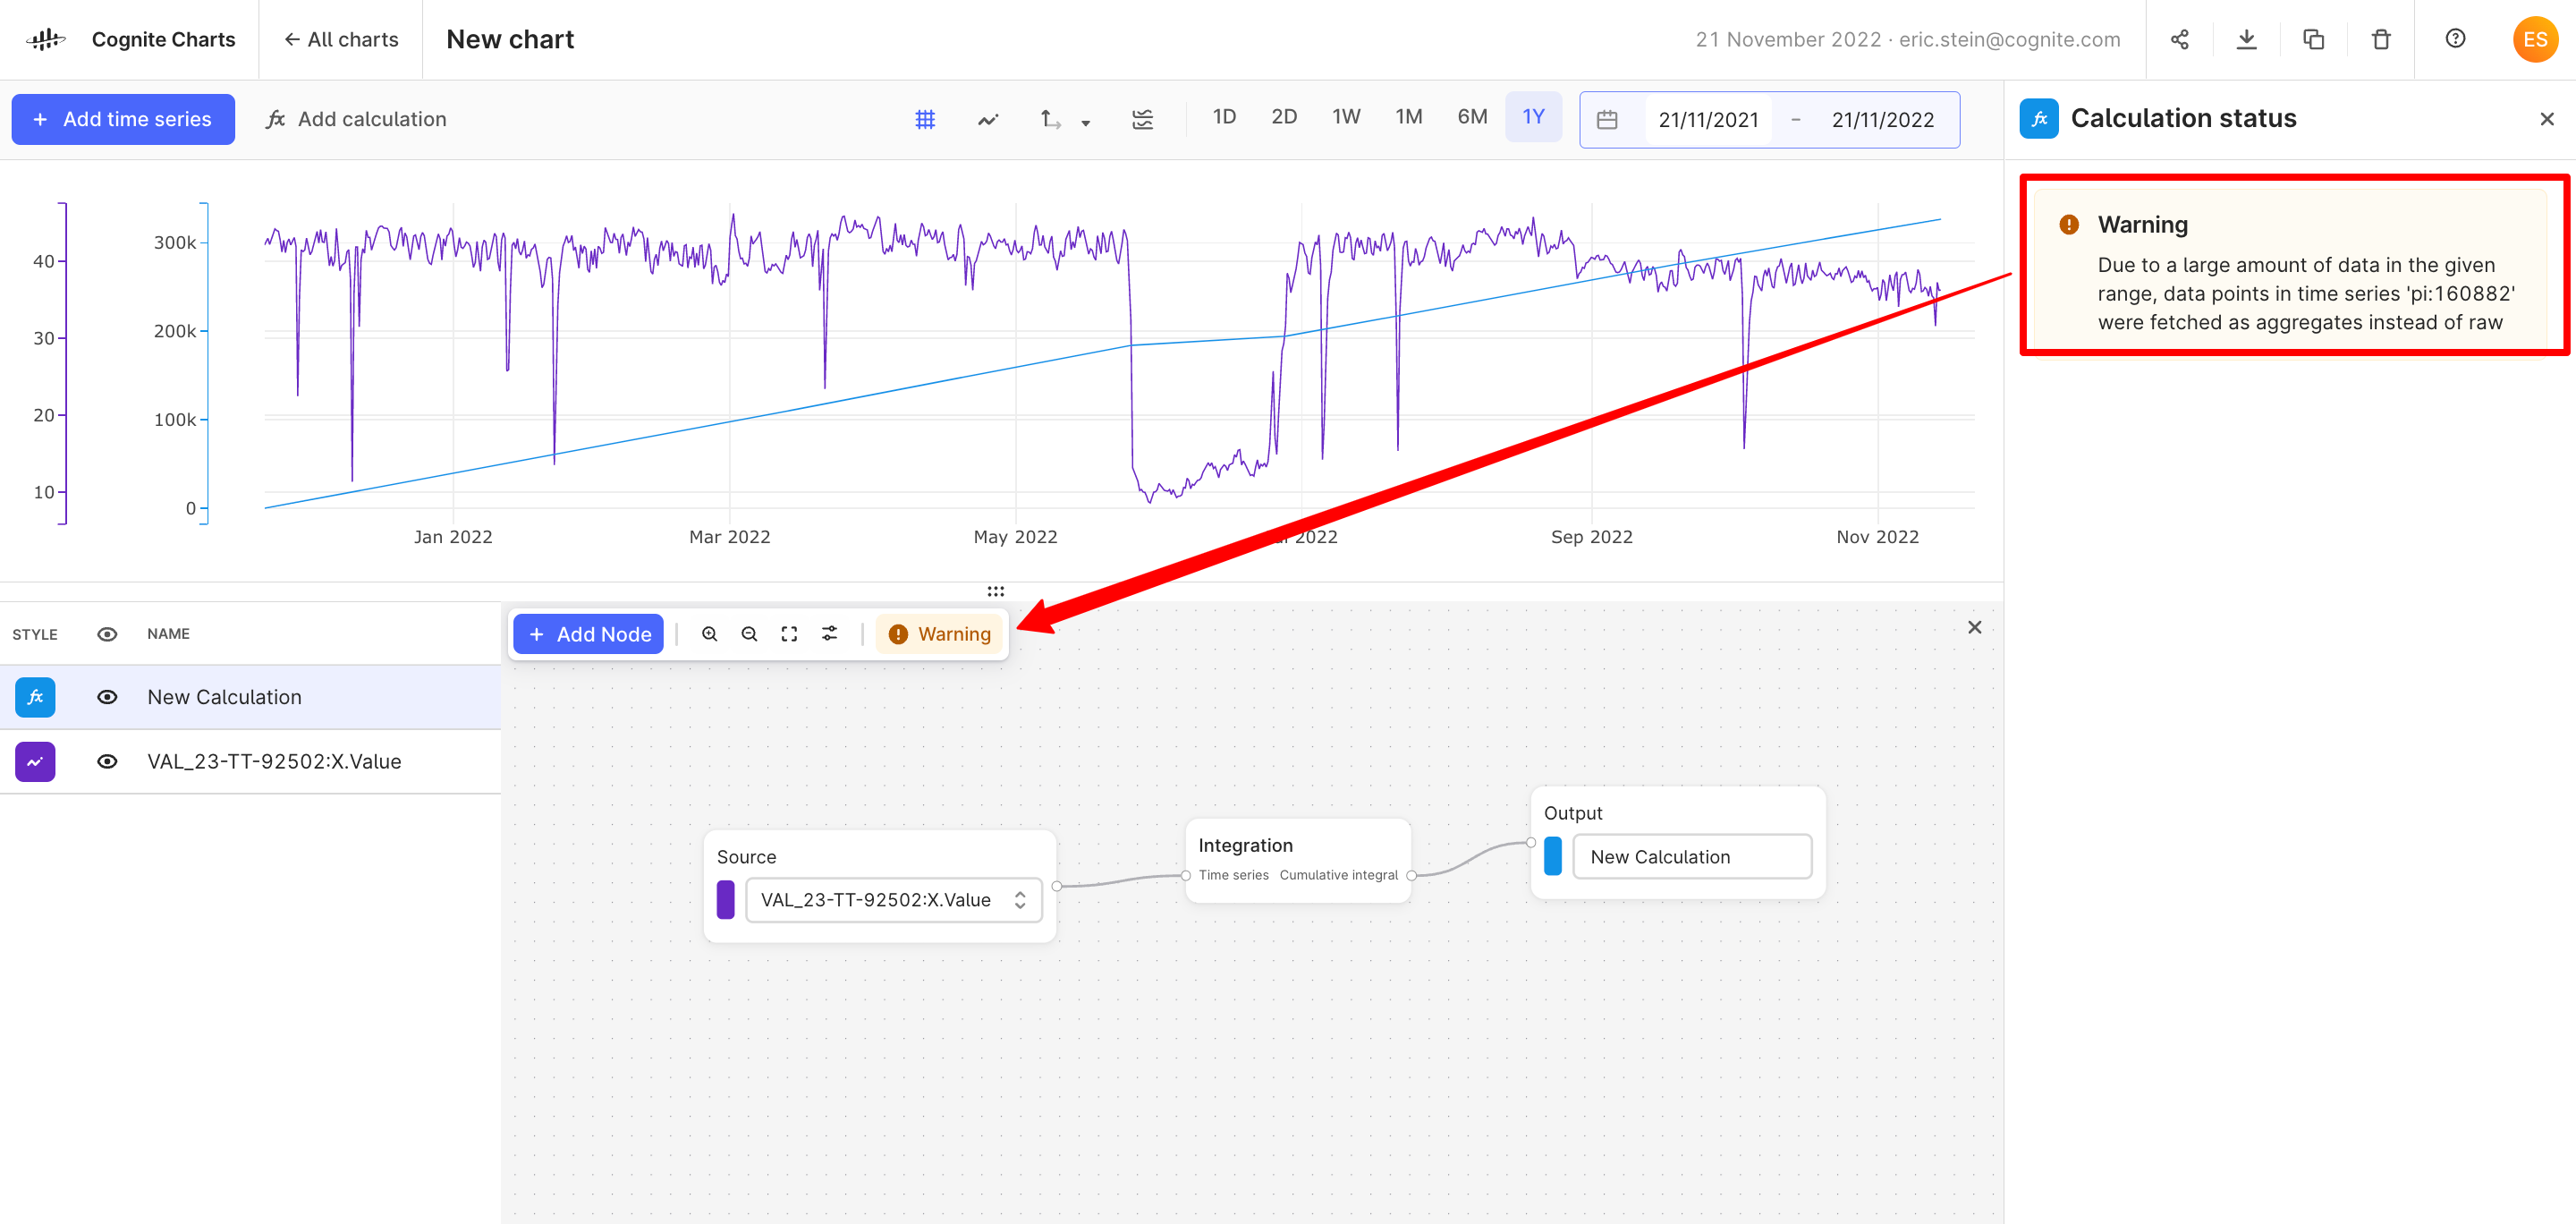
Does Charts currently support the option to create cumulative sum calculations? For example, when calculating total usage/consumption of fuel gas across the site, the user usually has to get the individual data points from the raw data sources and then do the calculation manually in an excel sheet. The user has to repeat these calculations every month.

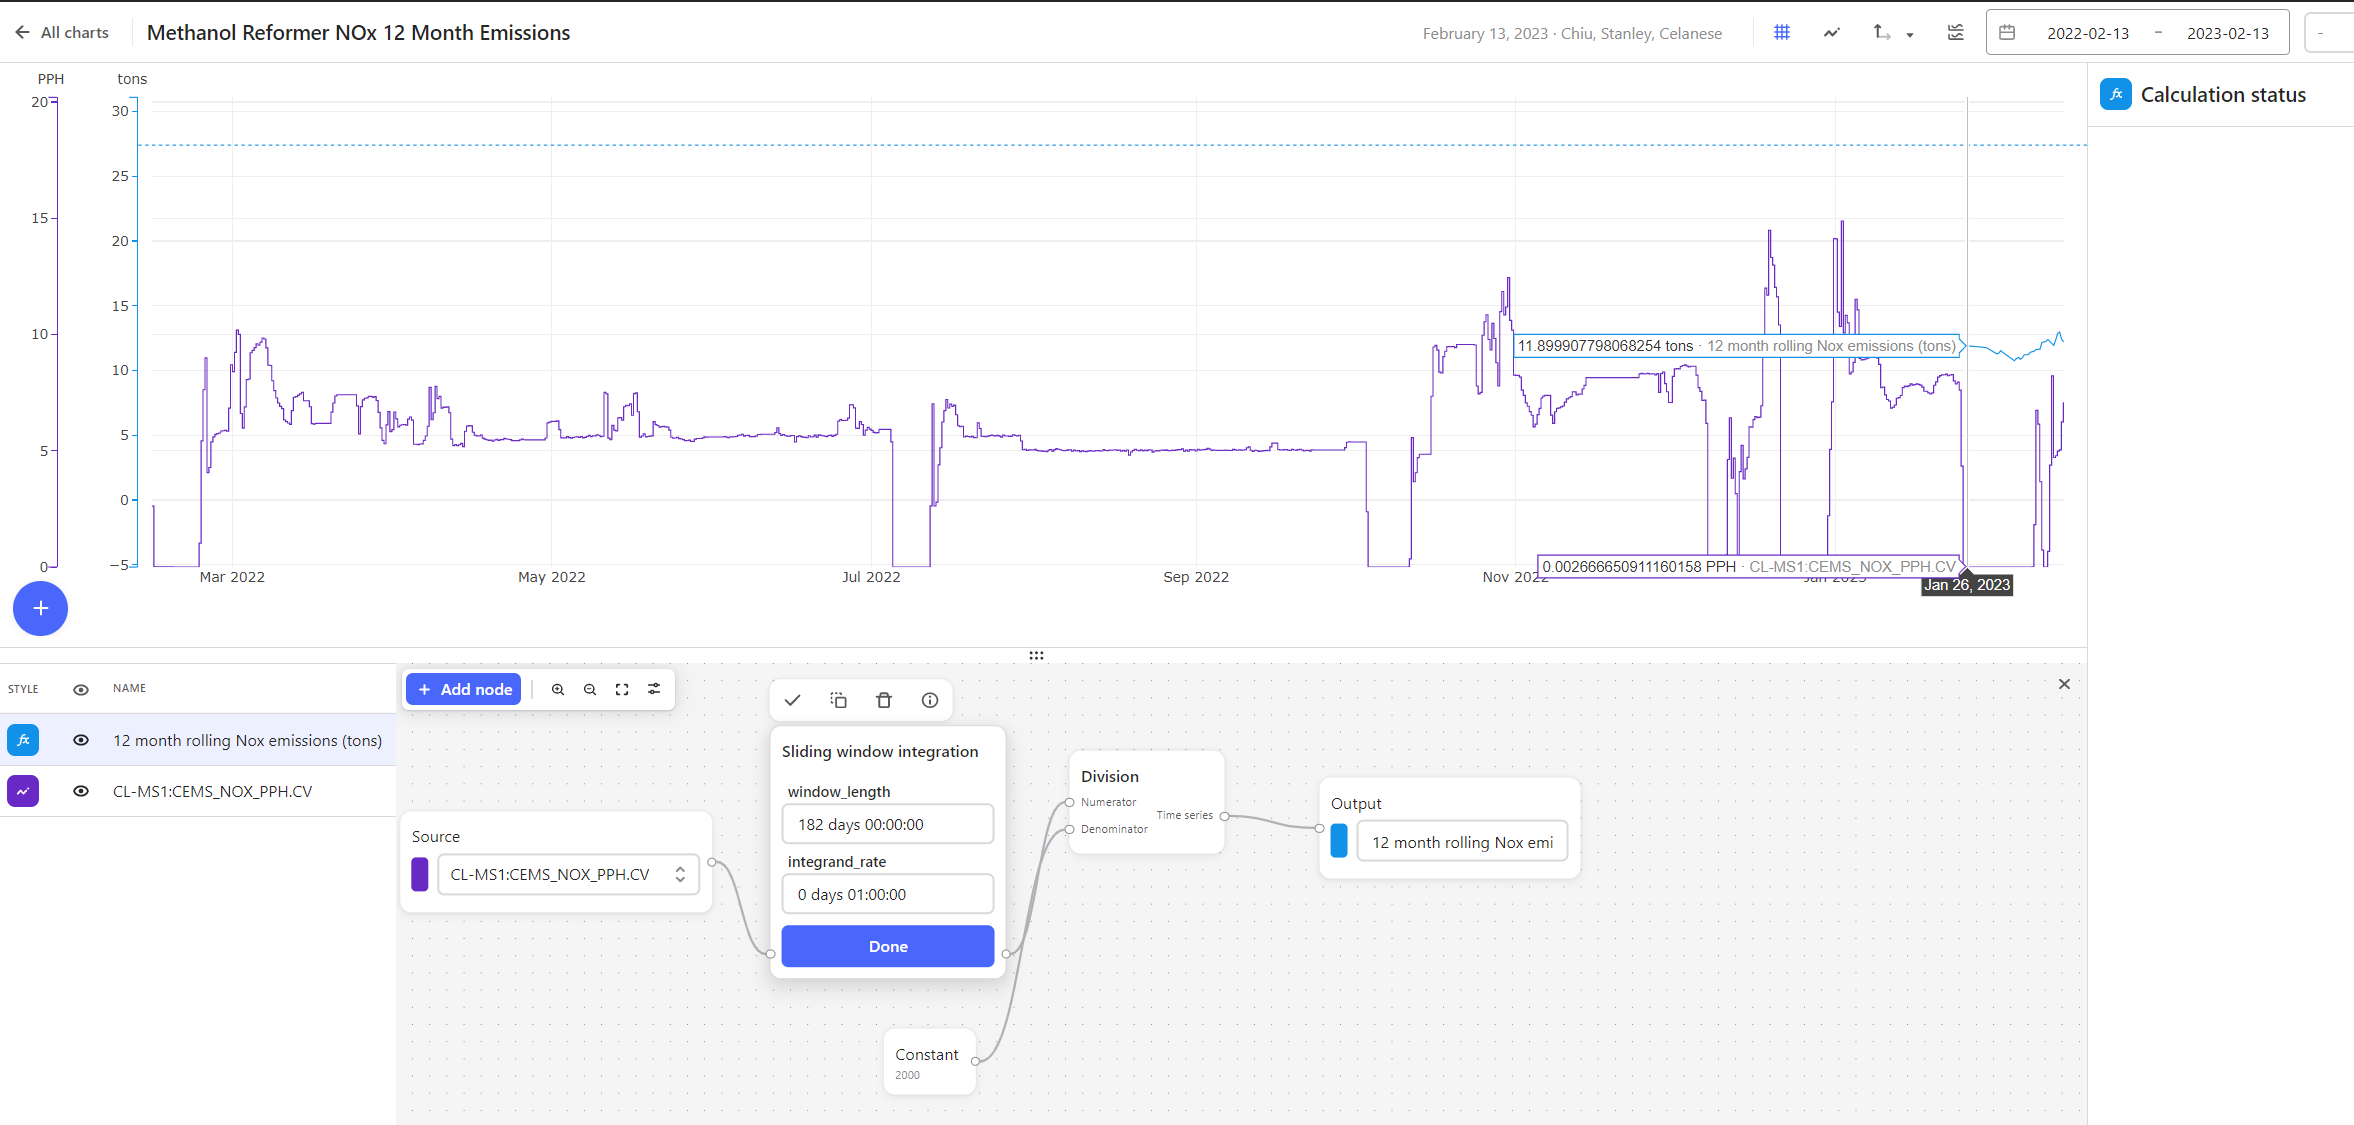
Could Charts potentially automate this calculation to provide real-time data to display a summary of data as it grows over time for consumption/usage? Also, would Charts be able to “reset” this calculation every month?  

icon

Best answer by Eric Stein-Beldring 21 November 2022, 16:13

View original

5 replies

Userlevel 5

Hi @crgomez13 and thanks for the question.

Yes, we have an Integration function (Function → Operators → Integration) that will do exactly this. The function includes a parameter so you are able to specify the frequency or granularity of the calculation (e.g. 1 hour):

The maximum result of this calculation (i.e. the right-most data point) will be the total, cumulative value for the range in view. You can view this max value by hovering your cursor over this value, in the Max column of the table below the plot, and/or by opening the statistics panel (clicking the ℹ️ icon). 

In addition, we have a Sliding window integration function, to measure cumulative values over a sliding time window, and a Cumulative sum (CUSUM) function, where you can visualize the cumulative sum of the positive or negative changes in the data. And if you have a request for an additional type of function to meet your use case, please do let us know!

Since all calculations are run on the fly based on the data in view on the plot, after you’ve created the chart with these calculations, you only need to change the date range to view results for the last day, week, month, etc. You can choose the quick date selectors along the top of the chart to quickly snap the view to that period and/or choose a date from the date selector. With that, Charts can absolutely be used to “reset” this calculation every month by re-loading the chart and choosing the date/time period of interest.

In terms of automating this calculation – i.e. Running this calculation on a defined schedule to create new data in Cognite Data Fusion as a calculated time series – this is functionality we’re working on right now. We’ll post updates to Cognite Hub as we make progress and open it up to early adopters, but this will be a focus for H1 2023. This includes being able to create monitoring tasks and set up alerts on these calculated values. 


Note: If you see a Warning for your calculation informing that:

“Due to a large amount of data in the given range, data points in time series _____ were fetched as aggregates instead of raw

then it means that your time series has more than 100k data points and has been downsampled to 10k data points for the range currently in view. I touched upon this topic in another thread here. If you or anyone at Celanese Clear Lake encounters this issue for a particular time series or calculation, please do reach out in this or a new post on Cognite Hub. From there, we can discuss and recommend the best strategy for resolving this issue, should it impact that use case.

Userlevel 4
Badge +2

Hi @crgomez13 

Just following up here from my side. Has Eric's above replay helped you?

Best regards,
Dilini

Userlevel 1

Hi @Eric Stein-Beldring 

Thanks for the detailed reply! Based on the current needs, I believe these options should work. Will test these out and will follow up if the users run into any issues. 

Looking forward to the automated calculations release!

Cheers!

Cristian

Badge

Hi @Eric Stein-Beldring, could you explain how the `sliding window integration` works? I am trying to use it to show a rolling 1-year cumulative sum, but when I entered 365 days into the integration window, it gave me an error “UserValueError('Integration time window length too long compared to the time window of the dataset.')”. 

I tried half a year and the result seems valid although I would like it to extend to as far back as my data set time window.


Userlevel 5

Hi @stanleychiu,

Since we currently do not fetch data beyond the range currently in view in the chart plot, this has some implications to how the Sliding window integration function, as well as others (e.g. Shift time series) perform and can be used. Namely, there will be a gap at the start the of the range equal to that of the window length. So, when you’ve set 365 days as the window length and are only viewing 1 year of data, there are not enough data points for the calculation to use since we are not (in the background) fetching the time series data points for previous points in time (i.e. To the left of the data currently in the plot). 

If you'd like to calculate for a larger range, you can simply zoom out or change the date/time window in view. Although note that the limit of 100k data points, as mentioned above, still applies – and is very important, since you’re performing an integration function.

Adding the functionality to run calculations on a user-defined range of time, including fetching data outside the range in view is a request we've received before (ref. this request) – @Knut Vidvei would be the best person to discuss with further and to share more about where this is on the roadmap.

Reply