Check the
documentation
Check the
documentation Ask the
Community
Ask the
Community Take a look
at
Academy
Take a look
at
Academy Cognite
Status
Page
Cognite
Status
Page Contact
Cognite Support
Contact
Cognite Support


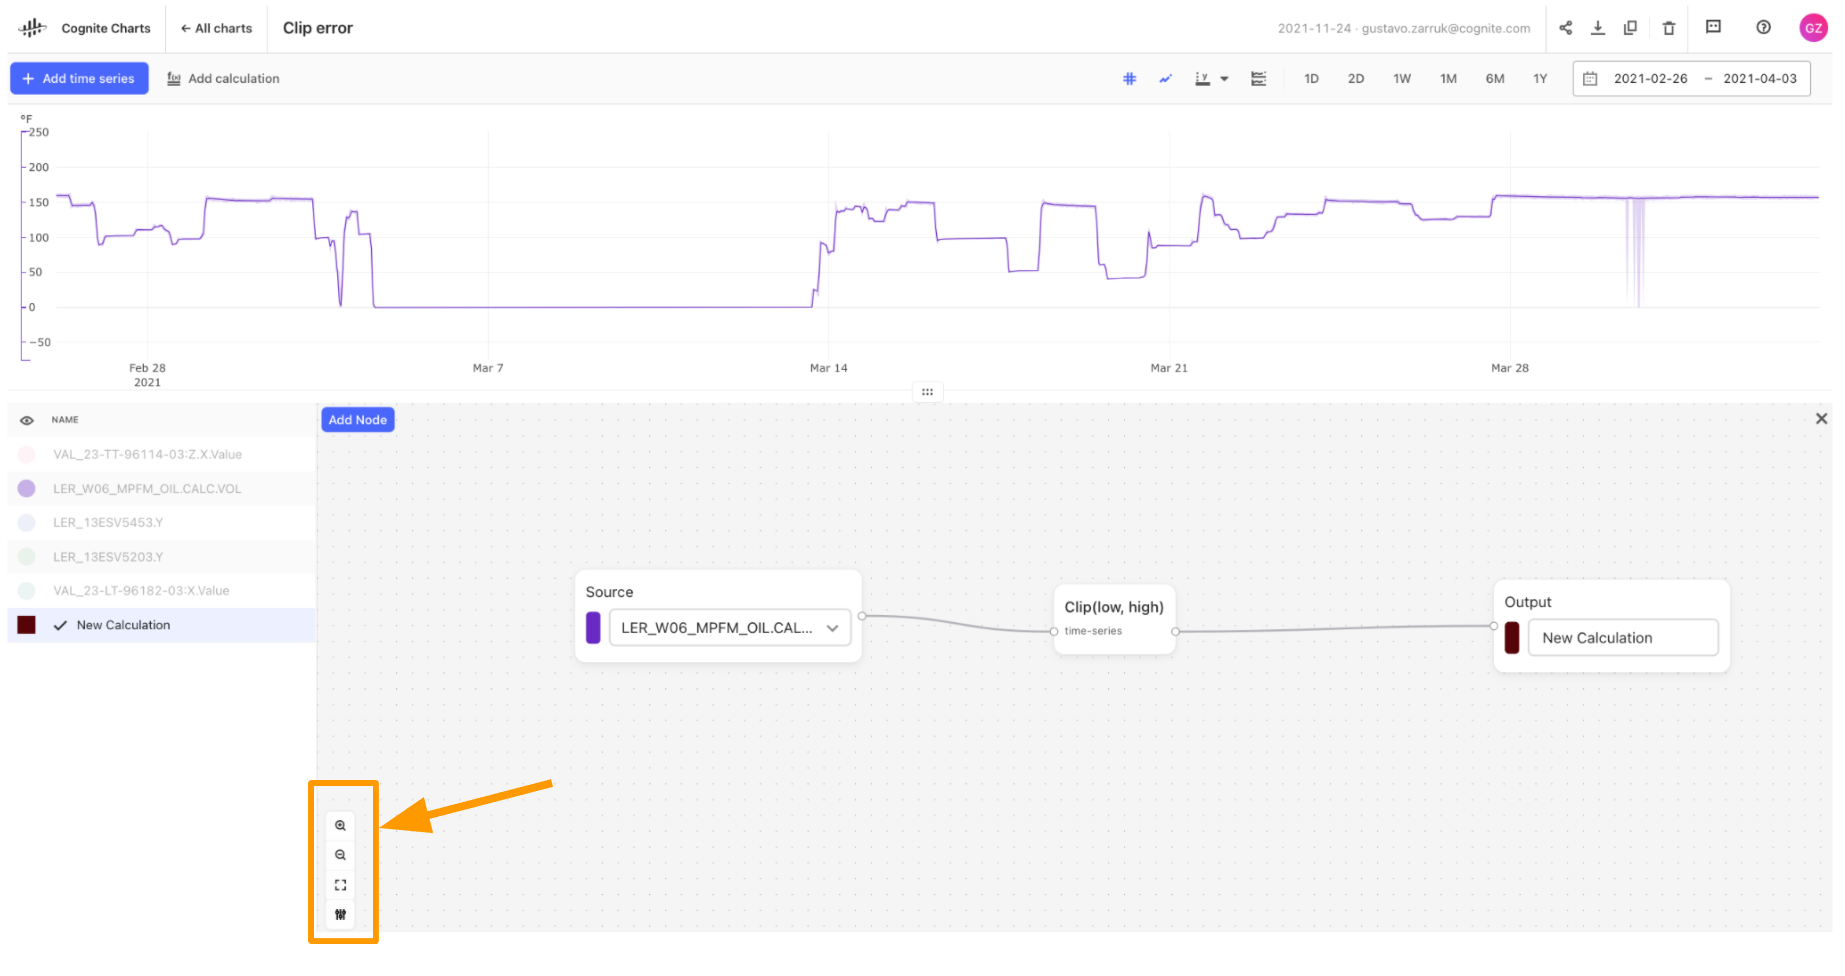
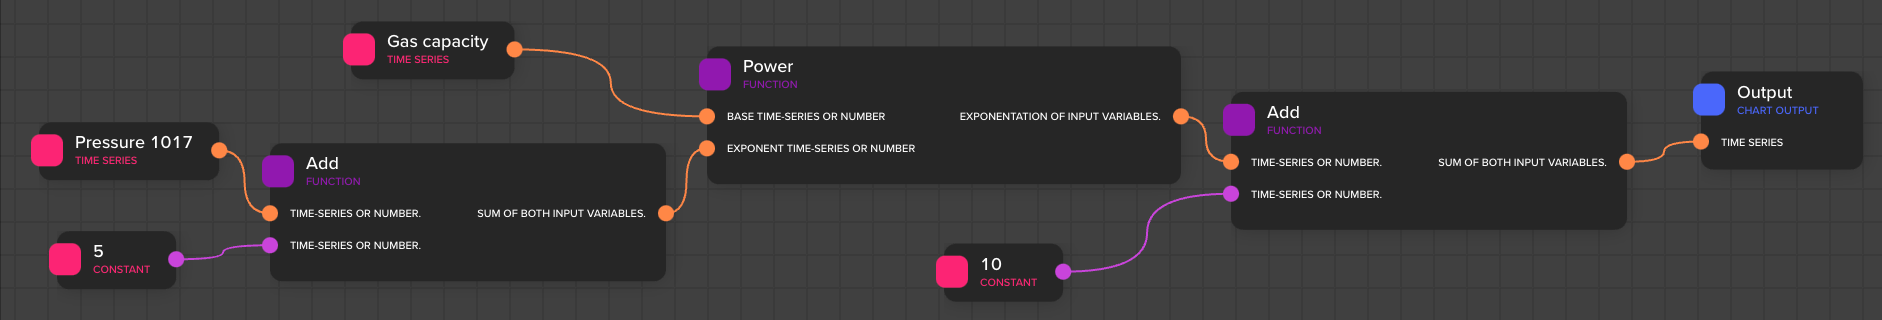
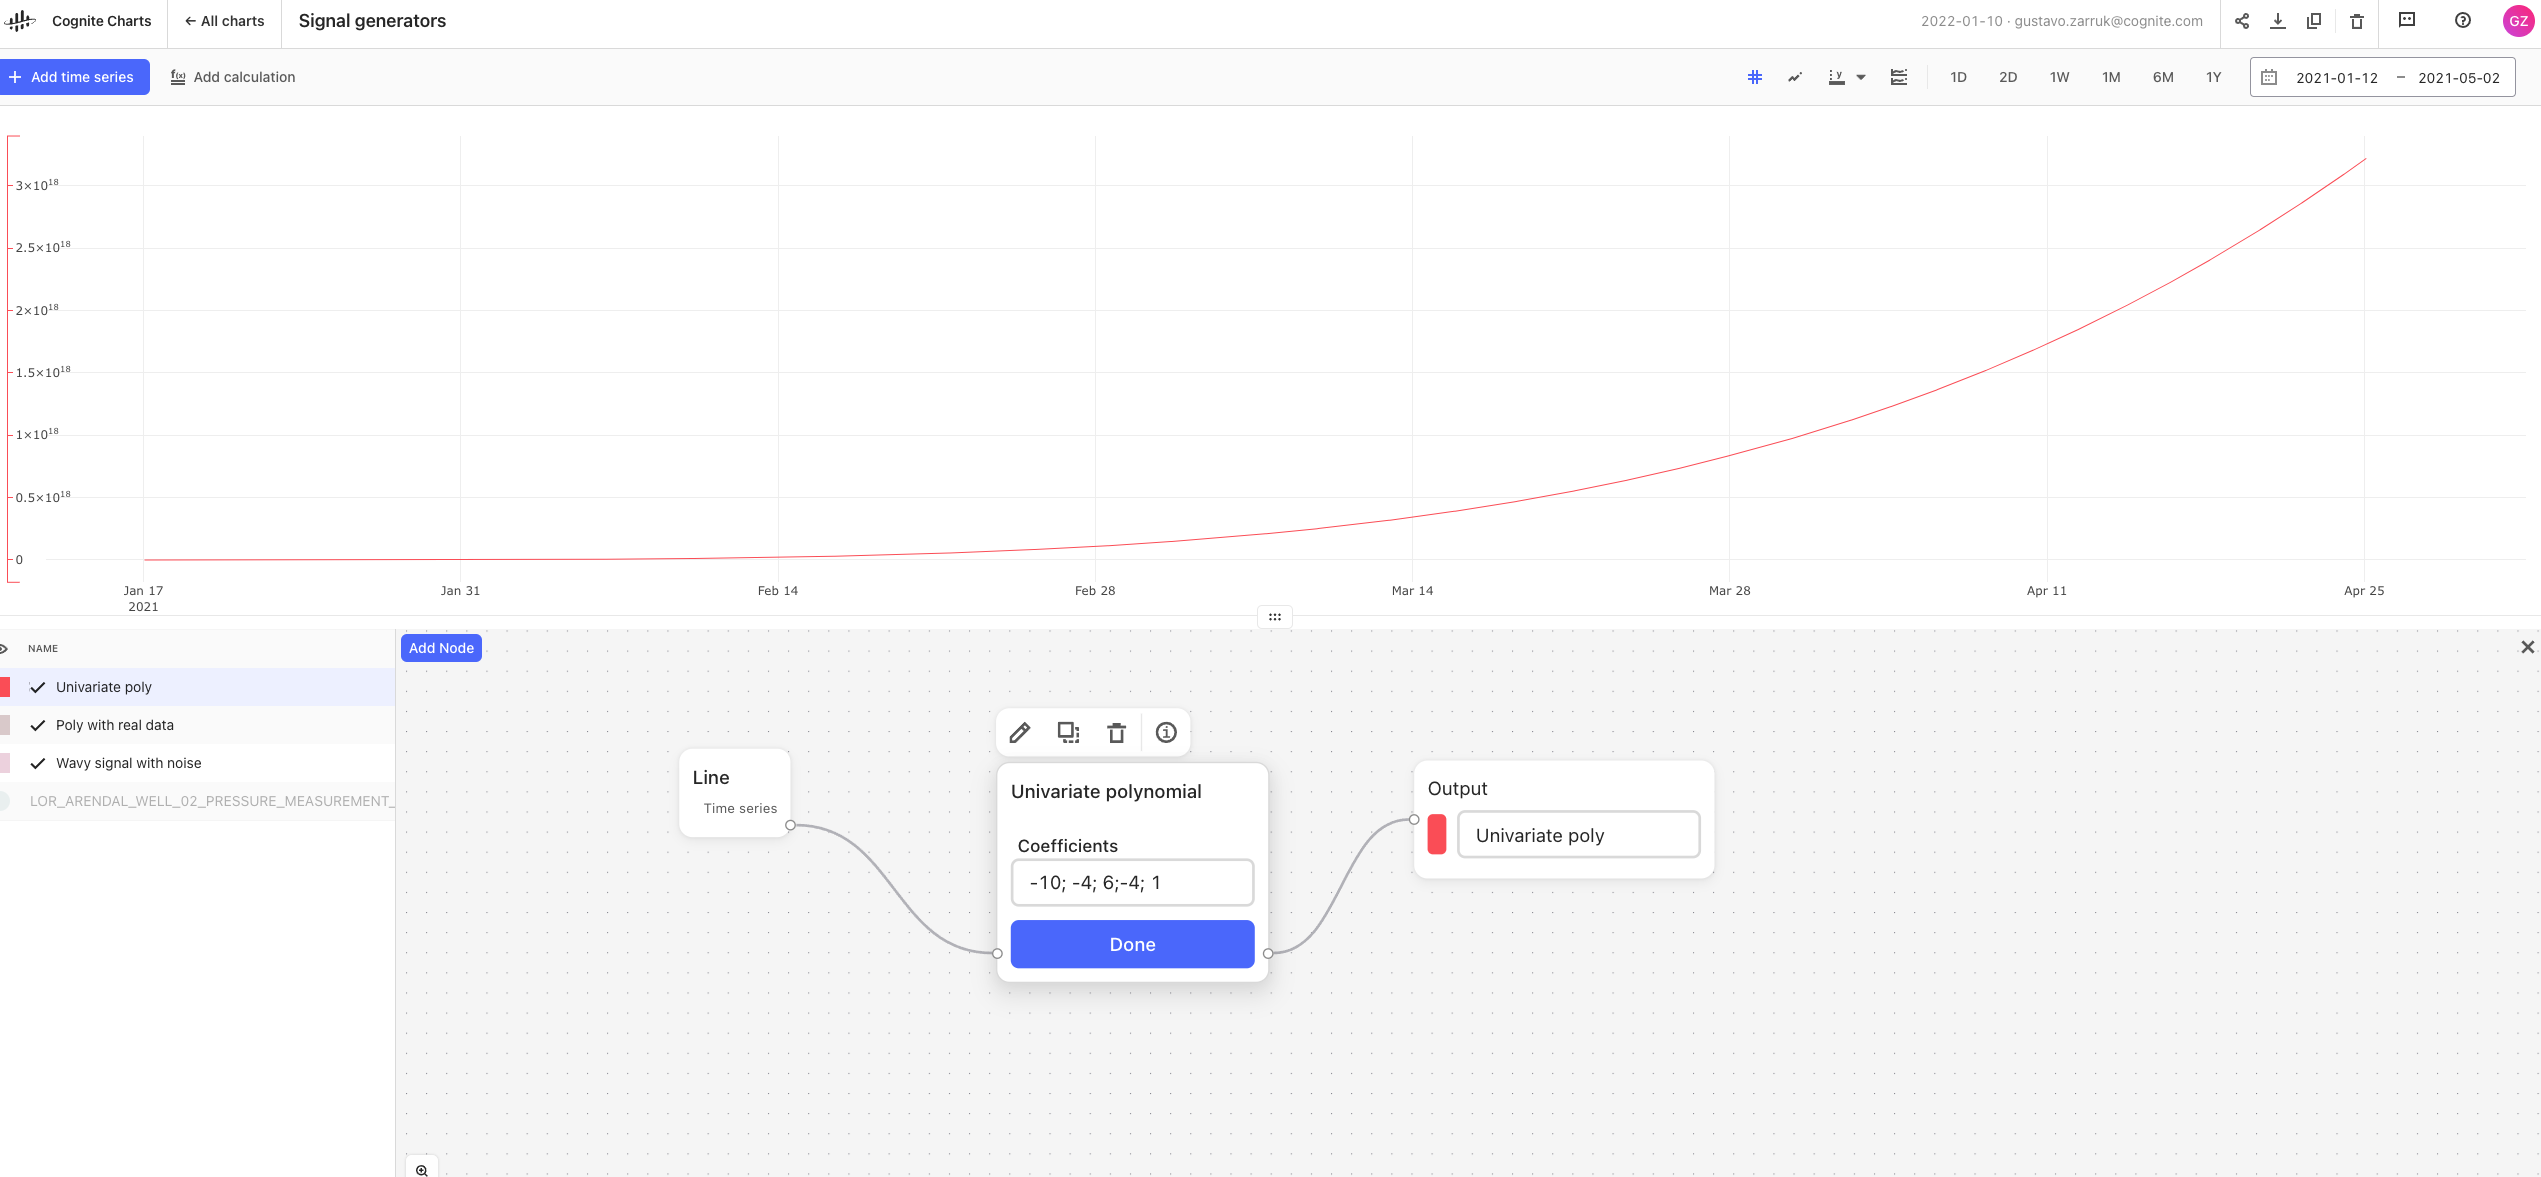
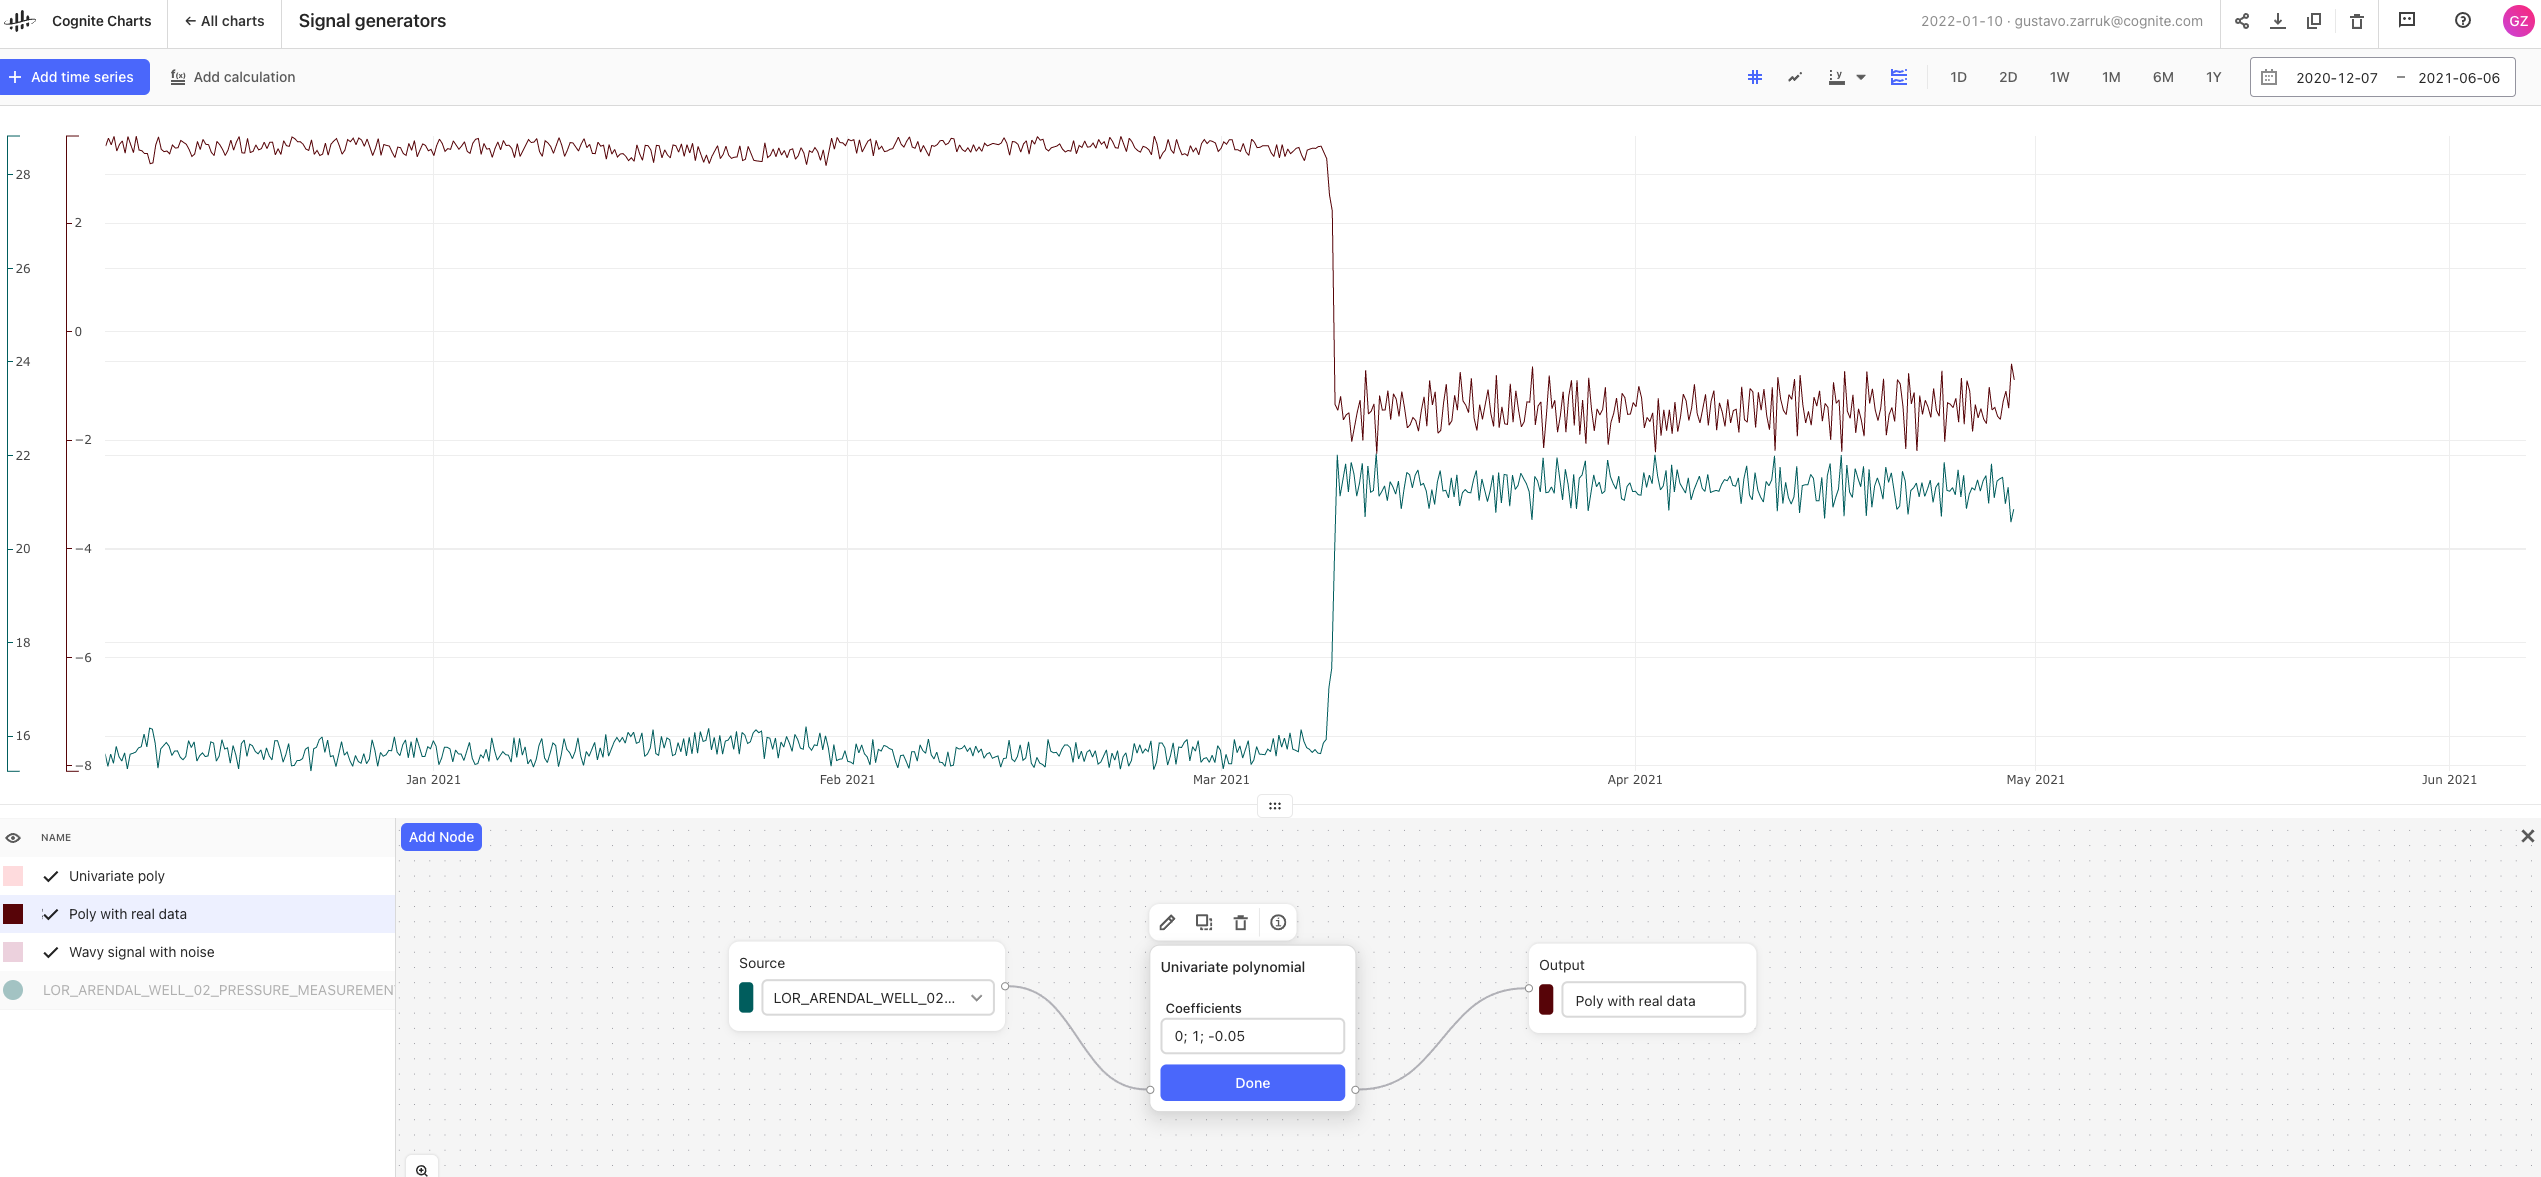
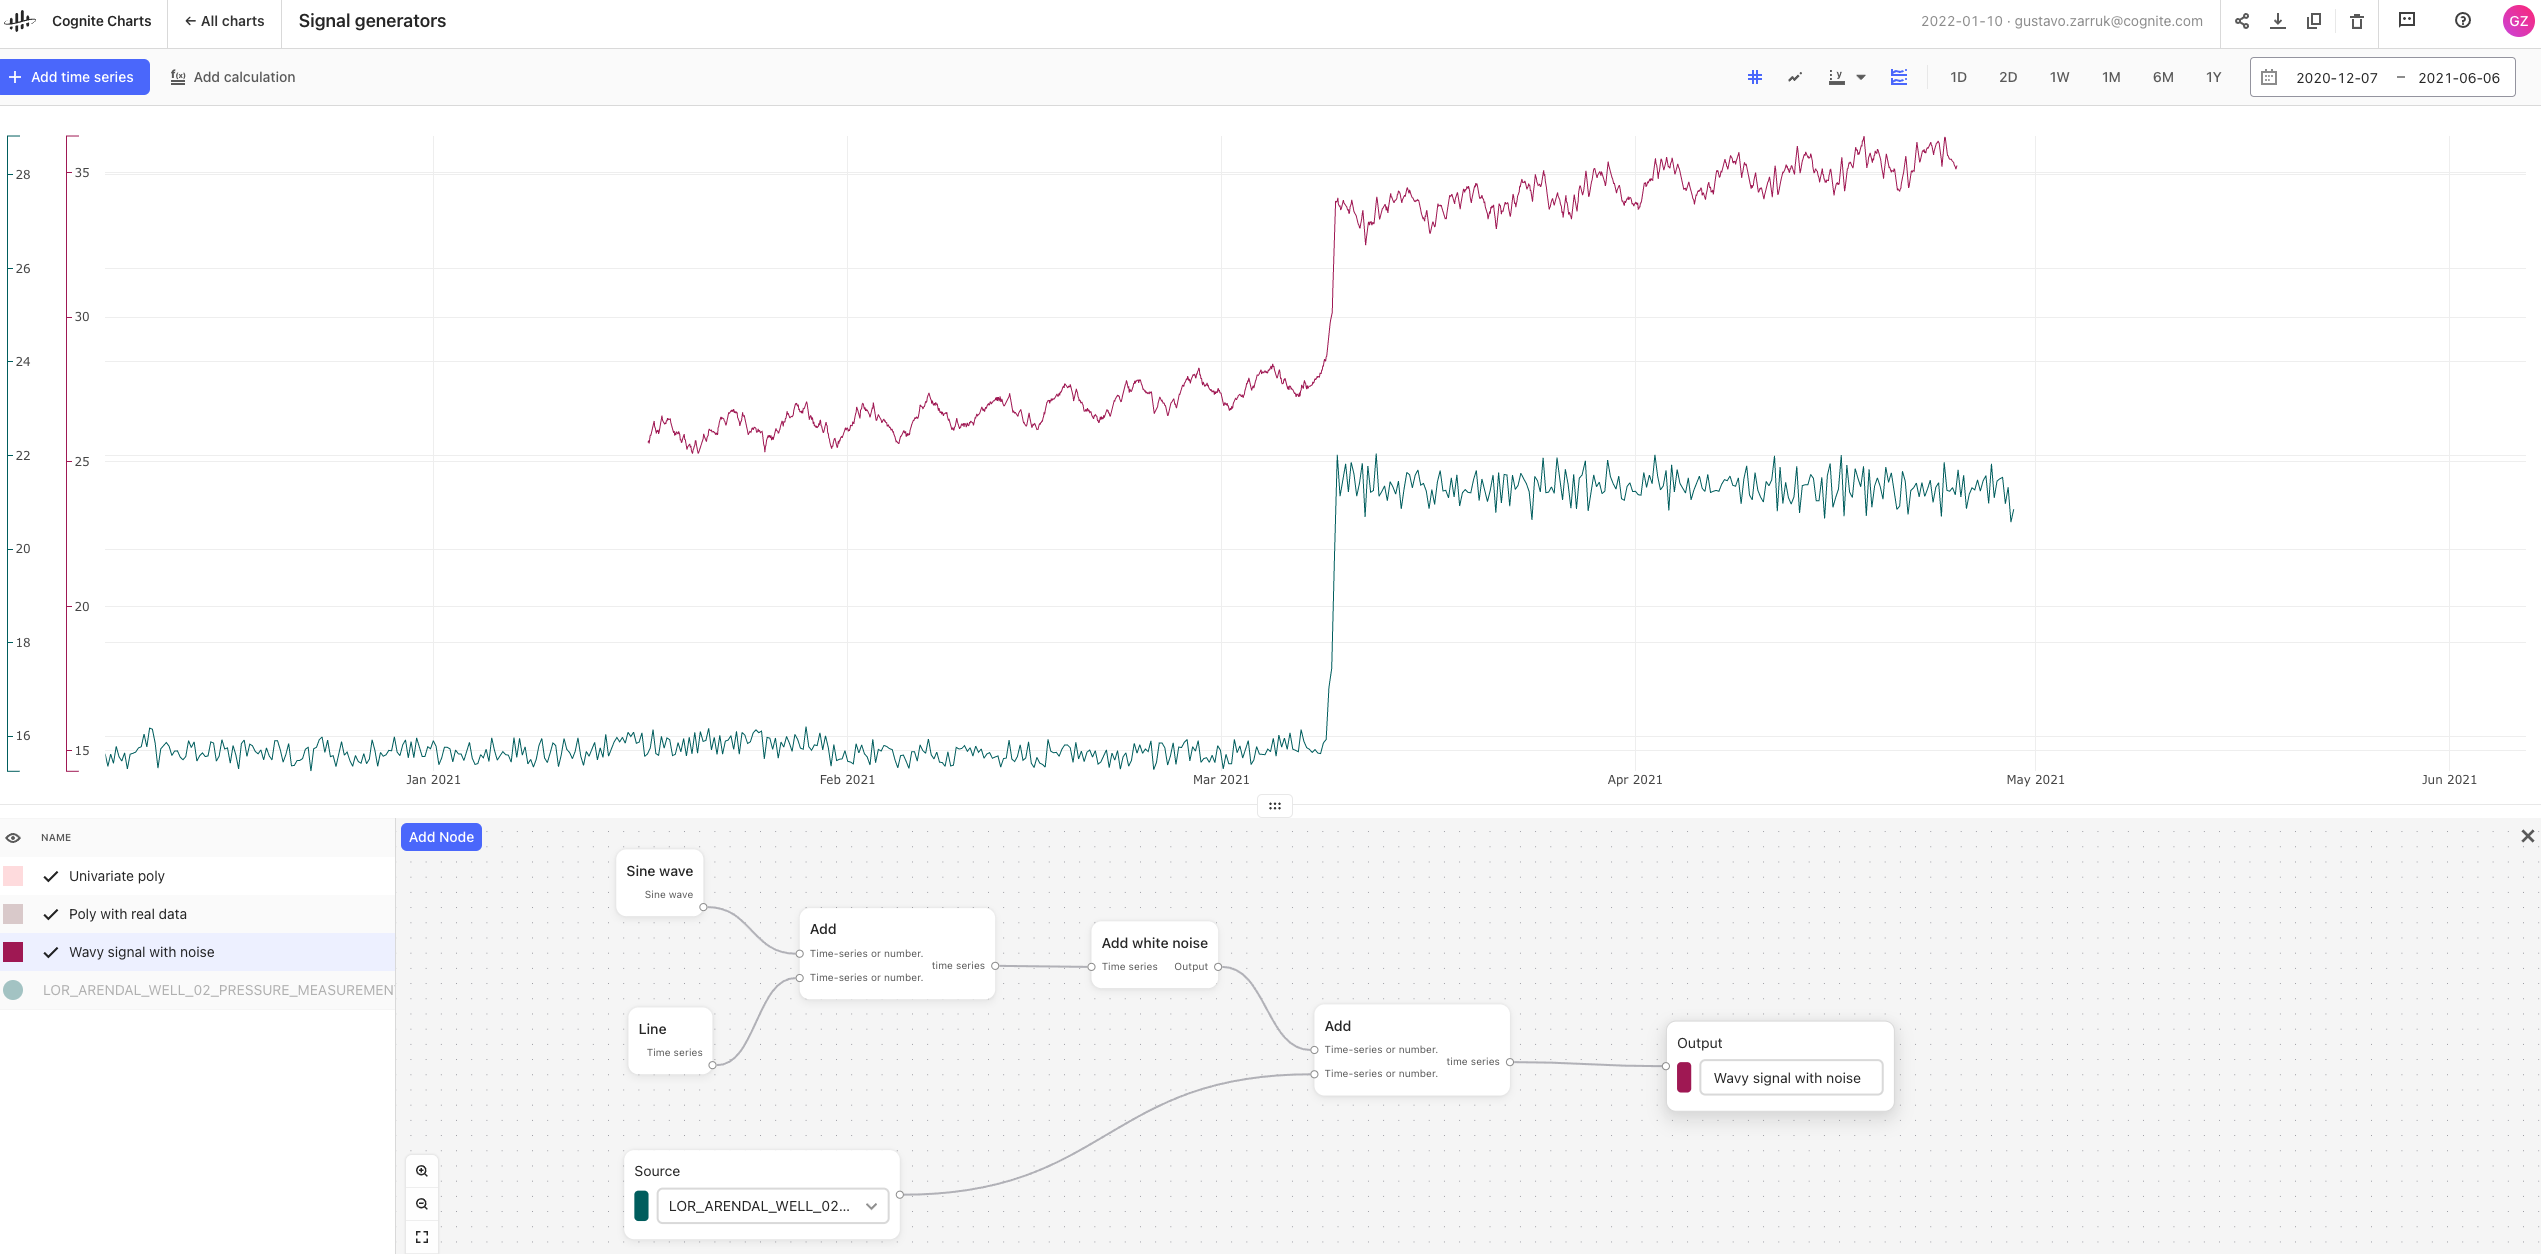
- can you enable scrolling just for the section of the page where one creates the logic? (see attached picture)
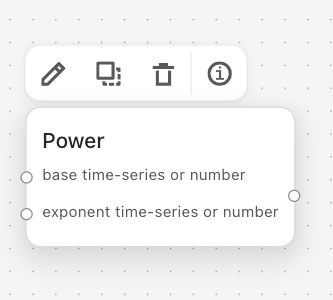
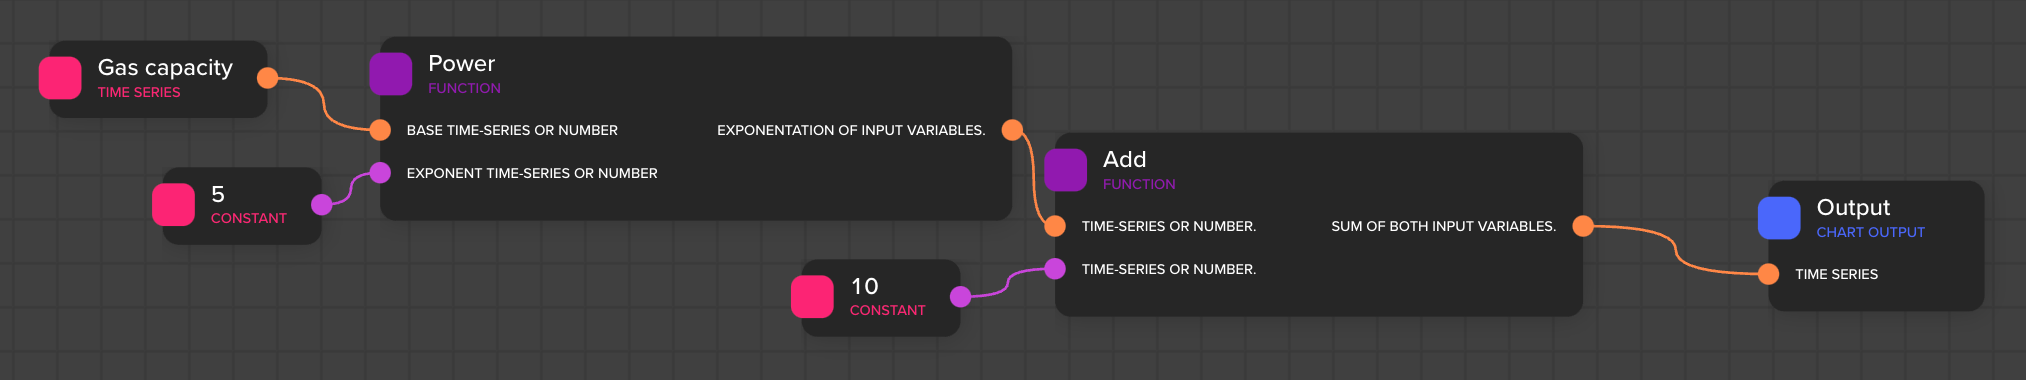
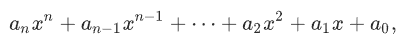
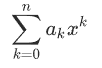
- it would be nice if I could specify the degree of an exp. for instance y = ax^b+c would be a second order exp, For my specific usecase a = timeseries, b = constant and c = constant.
Best answer by Eric Stein-Beldring
View original