Question

Charts - How many hours an equipment is operating?

  • 5 February 2024
  • 5 replies
  • 128 views

Userlevel 2
Badge +4

Hello everyone.

I have a use case that I have been trying to figure and I'm hoping you could help me.
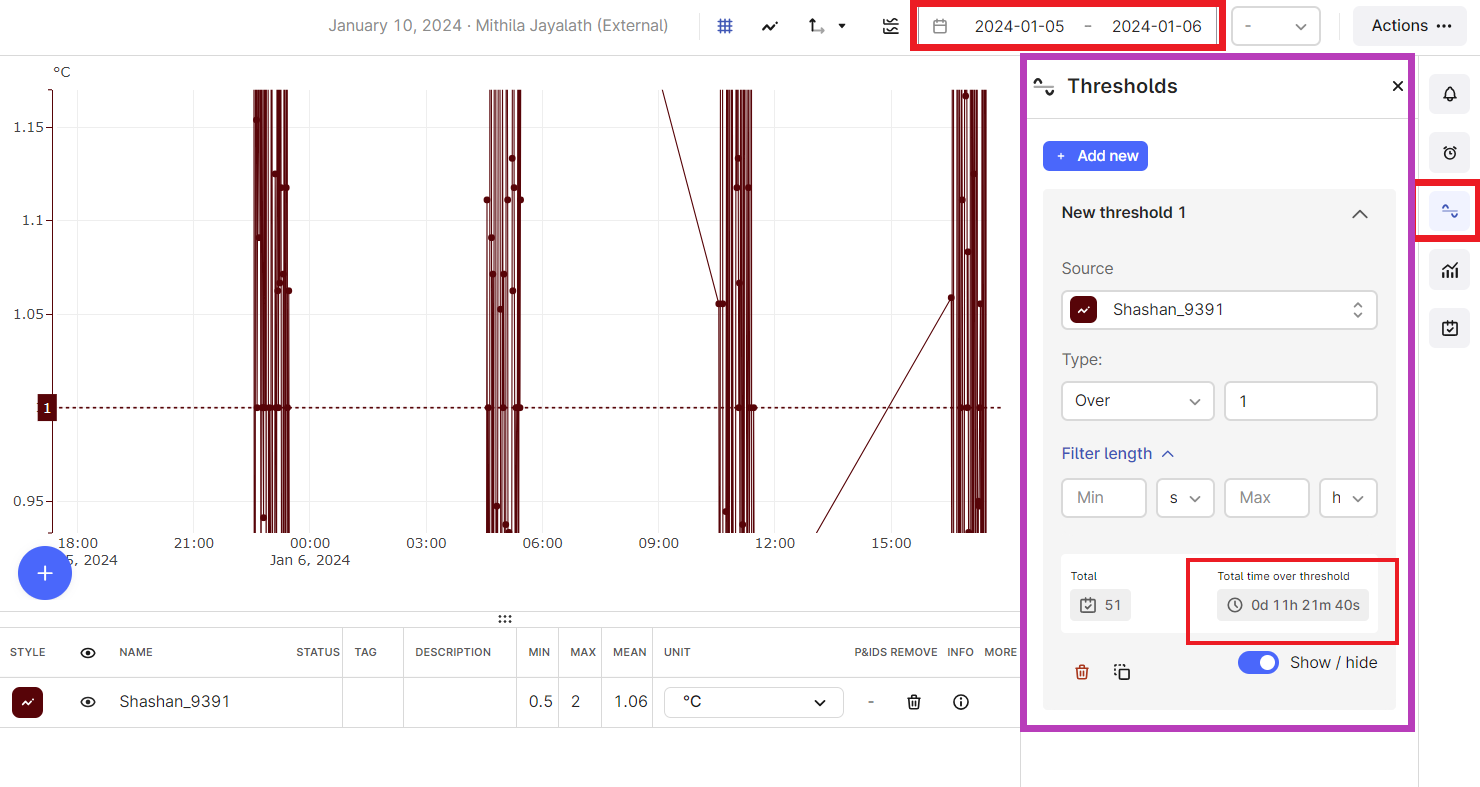
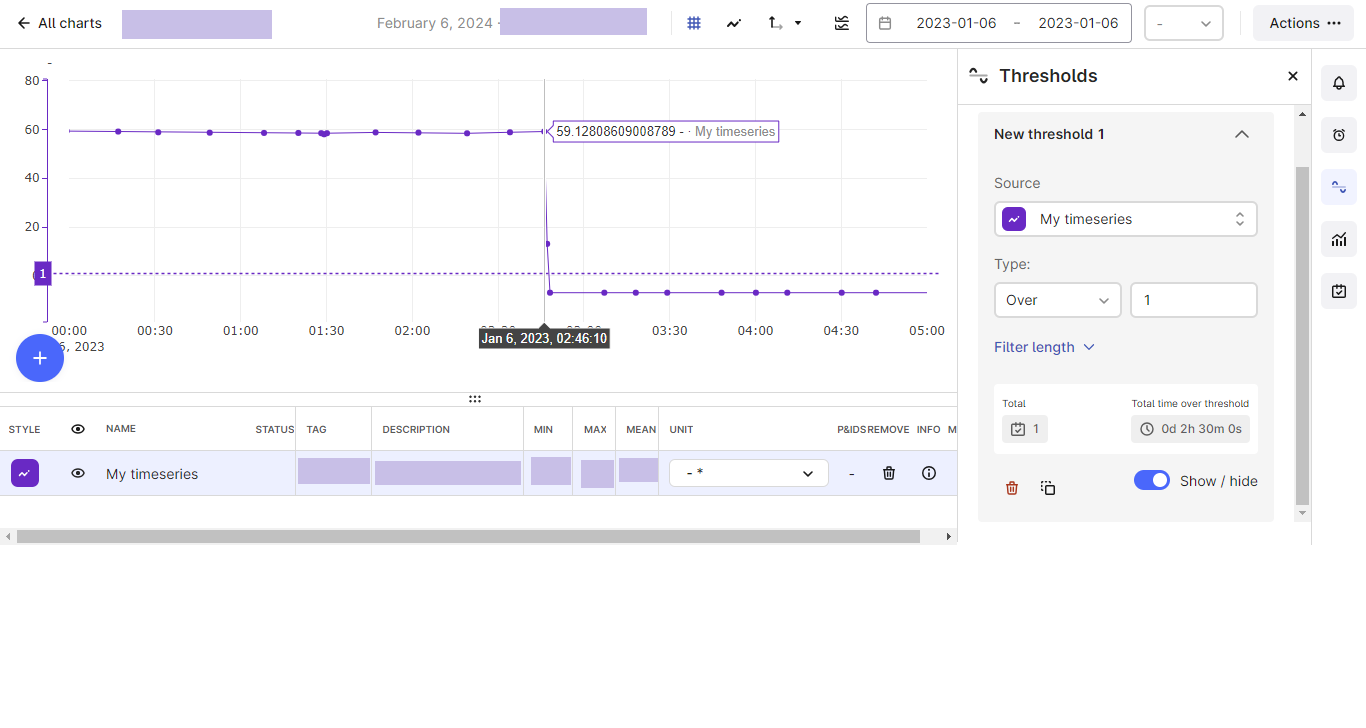
We have an equipment, let's say a pump, and we have a timeseries for its flow. We consider that the pump is operating as long as the flow is above a threshold.


In PI, if I want to know how long the pump was operating, I can simply use PITimeFilterVal function in Excel to retrieve the amount of time that the timeseries was above the threshold.


Me and my team have been trying to do this with Cognite, with no success. We tried transforming the timeseries to a 0 or 1 using the “Threshold” function, and then integrating it, but we have faced some limitations due to the approximations that are intrinsic to the integration function.

Unfortunately, I cannot show you the actual data, be we checked a few days where the pump starts the day operating - at 00:00 - and at 2 am our integration gives us a value of 1.84h - when it should be as close as 2h as possible. This difference, even though slight, is important for our end user.


Do you have any ideas how we can get this number using Charts?

Thank you.


5 replies

Userlevel 2
Badge

@dalvaniamp Try using thresholds in Cognite charts. You can create a chart using the timeseries of the equipment and create a threshold and check the total time over the threshold. Please refer to the attached screenshot. 

You can also monitor the timeseries using Cognite charts.

Doc links:

https://docs.cognite.com/cdf/charts/#thresholds-on-historical-data

https://docs.cognite.com/cdf/charts/#monitoring

Userlevel 2
Badge +4

Hello Mithila, thank you for your response!


We tried using the threshold, but unfortunately, there are some uncertainties as well. Take a look at this example: the timeseries starts the day at about 50, then drops to less than 1 around 2:46. The total time should be approximately 2:46, but it says 2:30. This is a meaningful difference for our user.


Userlevel 2
Badge

 @dalvaniamp in this case the total time over the threshold is calculated from time between the first datapoint above the threshold and the last datapoint over the threshold. Please refer to the attached screenshot.


Userlevel 4
Badge +2

Hi @dalvaniamp,

We are following up to see whether you're satisfied with the responses you've received?


Userlevel 2
Badge +4

Hello @Dilini Fernando! Unfortunately, we could not find a solution to this use case yet. We tried the integration approach and also the threshold in charts, both give us a result that has a significant difference from the PI calculations. We will continue investigating the issue.

Reply