

 Check the
documentation
Check the
documentation Ask the
Community
Ask the
Community Take a look
at
Academy
Take a look
at
Academy Cognite
Status
Page
Cognite
Status
Page Contact
Cognite Support
Contact
Cognite Support


Release v0.19 of Charts
Hello everyone,
The team and I are happy to announce that a new version of Charts (charts.cogniteapp.com) has been released!
In place of a live webinar, I’ll be posting videos soon to provide both a walkthrough of these new features and some concrete examples of use cases they help to solve. In the meantime, enjoy reading the release notes and, as always, please leave your feedback or questions in the comments below.
Release Details
- Filters are now available in the search panel
-
We’ve released some important and frequently asked for filtering capabilities in the
+ Add time seriessearch panel. -
Everyone who uses Charts is always interested in and looking for time series. Equipment tags (assets) that do not have any time series directly related to them are now automatically filtered out of the results list, providing you with more relevant and useful results. You can always show the “empty” equipment tags, if you’d like via the new filters dropdown.
Empty equipment tags are automatically filtered from the search results - You can also filter for time series by type, e.g. “standard” linear
Time seriesorStep time series.
Filtering for string time series -
Note: Since we currently do not support visualizing
String time seriesin Charts, this option is disabled for now.
-
-
→ Are you interested in more specific filtering capabilities? Let us know in the comments below.
- Display time series and calculations using step or linear interpolation
- There had been a bug where some step time series were being displayed on the chart using linear interpolation. We both fixed this bug so all times series of type
stepare automatically being displayed using step interpolation and we added this interpolation customization in the style editor. - This means that you can also display calculations using step interpolation when needed to provide an accurate visualization of the results.
Customize interpolation style to linear or step
- There had been a bug where some step time series were being displayed on the chart using linear interpolation. We both fixed this bug so all times series of type
- Various of bug fixes + quality front-end and back-end improvements,
- InDSL (Industrial Data Science Library) updates including…
-
New functions added to the ”Operators” toolbox:
-
Arithmetic mean: Simplifying the process needed to create an arithmetic mean function for two time series. While, before, you would have to create a calculation like: (TS1+TS2)/2, you can now do this with simply one function node:
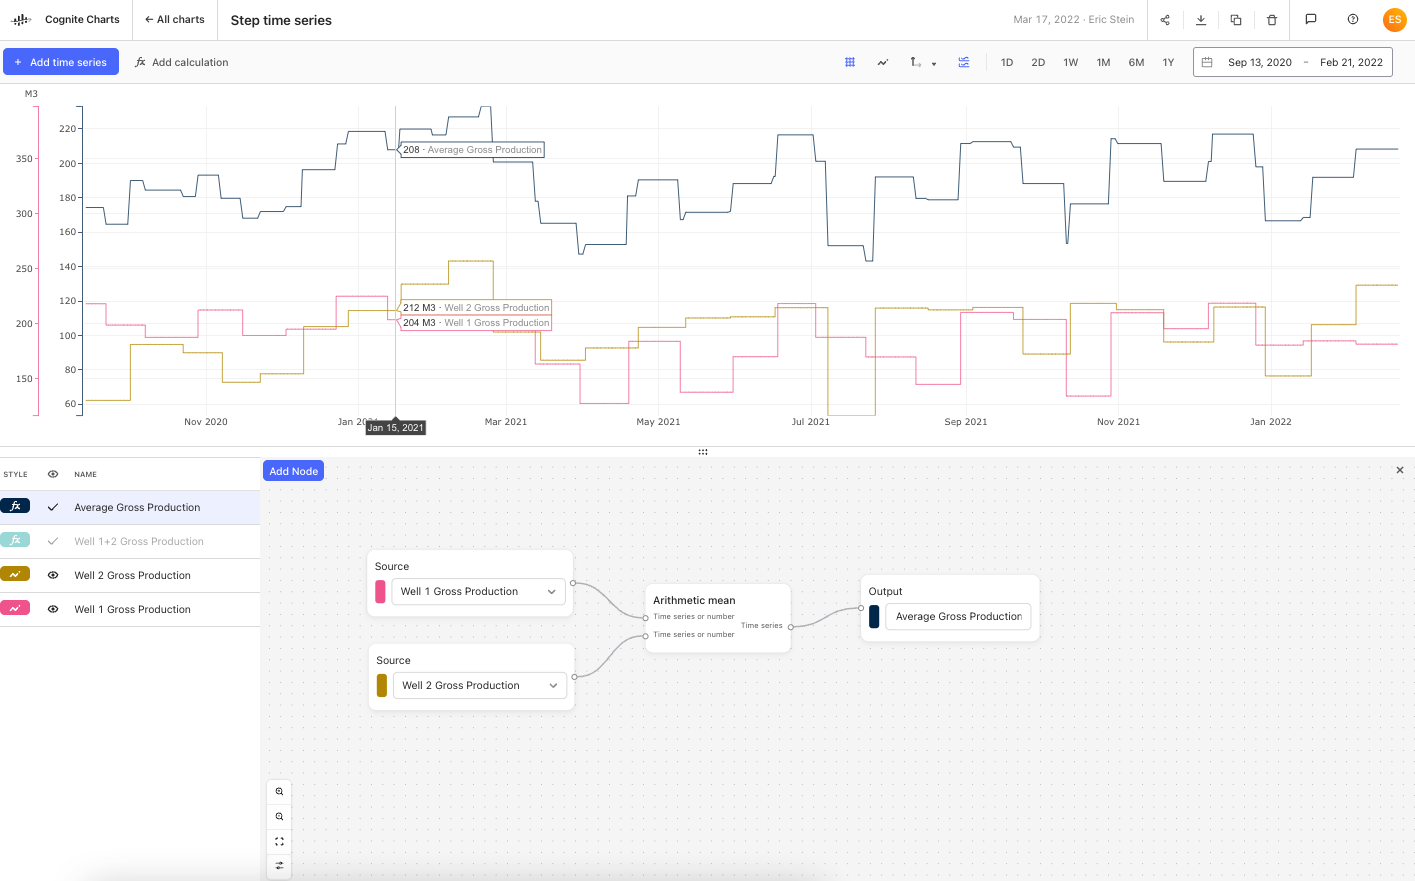
Arithmetic mean of two time series in Charts - Note: In the future, we will support the ability to add
nnumber of inputs to the arithmetic mean and other relevant functions.
- Note: In the future, we will support the ability to add
-
- New functions added to the ”Operators” (Numerical Calculus) toolbox:
- Sliding Window Integration: Siding window integration using trapezoidal rule, that uses an integrand rate of your choosing. This means that you can, for example, carry out a sliding window integration of the data over 1 hour periods.
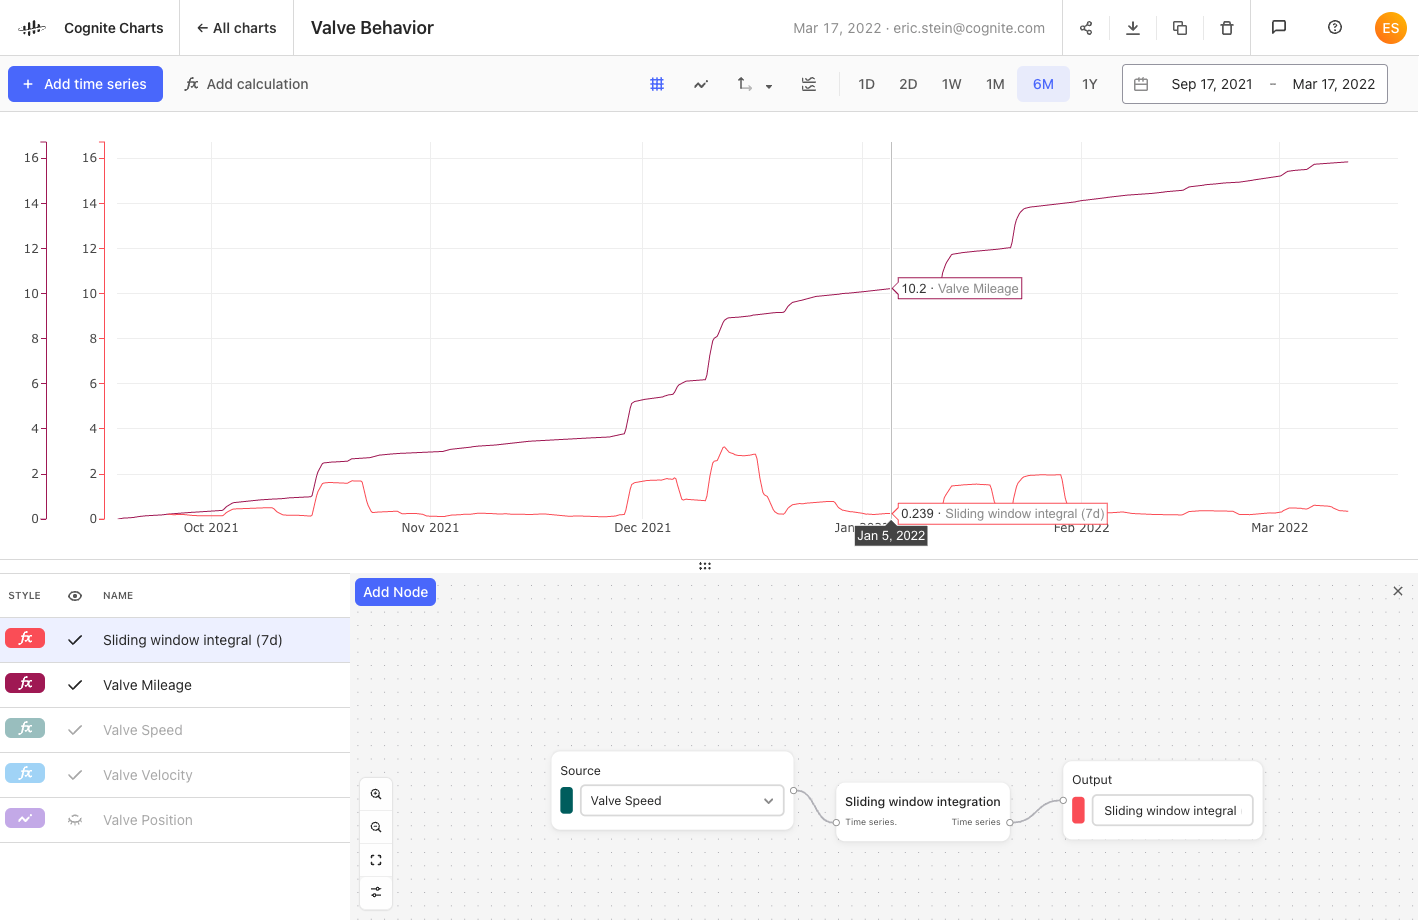
Sliding window integration calculation in Charts 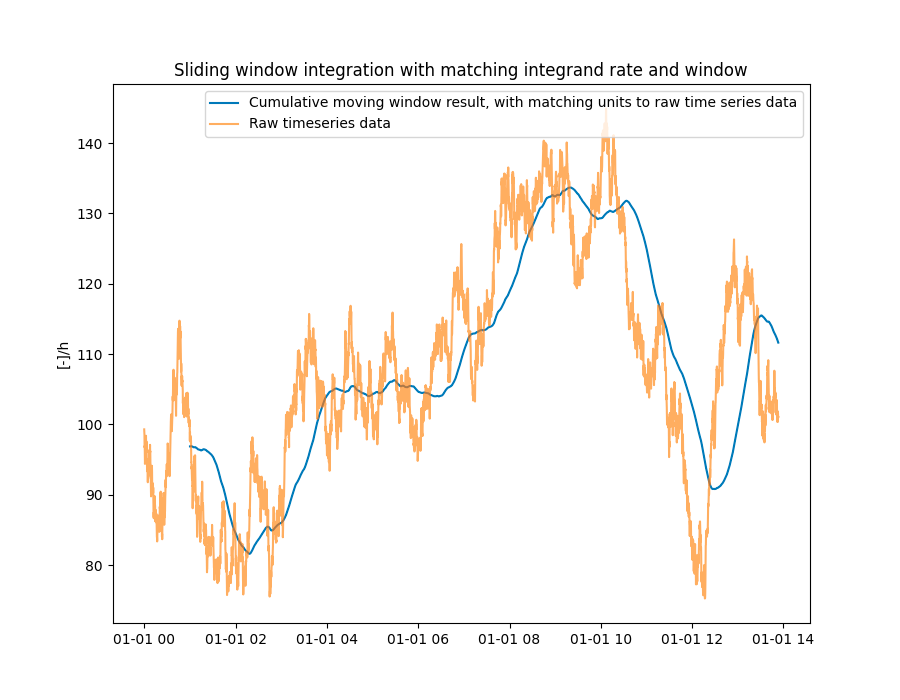
Sliding window integration from InDSL example gallery
- Sliding Window Integration: Siding window integration using trapezoidal rule, that uses an integrand rate of your choosing. This means that you can, for example, carry out a sliding window integration of the data over 1 hour periods.
-