Charts: I found a bug or have a question. What do I do?


Userlevel 5

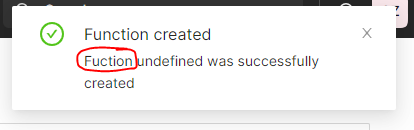
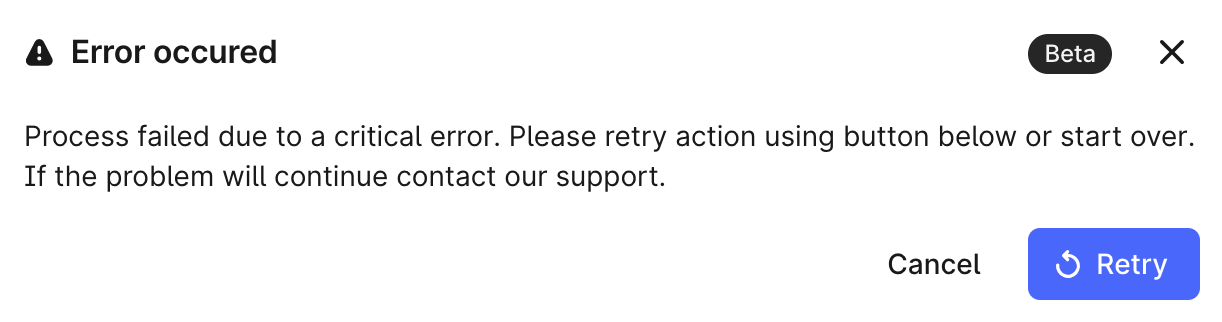
Found a bug? Have a question about how something works? We want to hear about it!

You can choose to either create a dedicated post (topic) in the Charts group by clicking the Create topic button OR simply post a reply below in this thread. Remember to include a screenshot or video to help the product team best understand what exactly you’re talking about or referring to.


13 replies

Userlevel 2

Hi, there is a bug in the clip function. If I set the low value to 0 it doesn’t calculate. It works if i put in 0.1. 

Hi Jonas,

Thanks for reporting the bug. You are correct, it is not working as intended. The function itself works correctly but the input 0 is not being interpreted correctly. We are fixing the bug and will let you know as soon as it is ready.

For the time being, your solution of using a very small number will work.

Cheers

Gustavo


Userlevel 1

Hi Charts Team,

In my previous experience, if a calculated time series contained too much data for Charts, it reduced the number of points in that time series to be presented in the chart. Now the behavior appears to be different. I receive what I remember to be the same error message about an excessive time span and fewer data points. However, the behavior is now that the time series does not span the length of the chart and appears to cut off when it has exceeded the available count for data points. This is making a number of charts unusable for me with limited time ranges that aren’t particularly useful for viewing data. 


Thanks,

Brendan

Userlevel 5

Hi @Brendan Buckbee and thanks for bringing this to our attention. I’ve done some testing as well and can confirm that there is something strange happening here.

When zooming in to a smaller range, then that calculation runs correctly when there are few enough data points, but instantly changes to calculating only a limited subset of the total range the moment it switches to using aggregates. 

What’s even more interesting is that the other calculations sometimes successfully run for the entire range using aggregated data points:

and sometimes experience the same issue:


Since you’re using very simple functions like Add and Divide, I suspect it’s an issue coming from our calculations backend. I’ve notified the team and are looking into it. Once we figure out the root cause and resolution, we’ll be sure to let you know.

Userlevel 2
Badge +3

Hi. We discovered a possible bug today.

A chart was set up by one user The chart contained sensitive timeseries that only a small group had access to. The chart also contained a simple calculation: subtraction between two sensitive timeseries.

This chart was made into a public chart. Another user, without access to the sensitive timeseries opened the chart. The sensitive time series did not appear (which is as it should be), but the calculation did - that is until he zoomed in the chart so that the calculation was done again, then the calculation disappeared.

There seems to be a caching of calcluation results in the chart, and these cached results are not governed by the access privilegues tothe underlying timeseries.

Userlevel 6
Badge

HI @Kristian Nymoen thanks for reporting, we’re looking into it and you’ll hear back from us as soon as possible

Userlevel 3
Badge

Hi, @Kristian Nymoen .

Thank you for reporting this. I will create an issue for this, and investigate immediately. As this is a bug you can also create a support ticket for this so you can track the issue through support. 

FYI @Magdalena Rut 


Best regards, Knut Vidvei

Any news on he label issue?

Badge

Typo :-)


Userlevel 6
Badge

@Magdalena Rut :)


Typo :-)


This typo fix is done on dev, and will soon be released.

Hi. Trying to interpolate / resample a time series, where the goal is to make it easier to be used by a Power BI report. I added all the necessary capabilities to save and schedule a calculation, but I only get a critical error telling me to contact support. See screenshot below. I used a simple time series with a constant value of 1 every 5 sec and wanted to see if I could get data points every second in a 20 sec period. The calculation I used was “Resample to granularity” 


Hi. Trying to interpolate / resample a time series, where the goal is to make it easier to be used by a Power BI report. I added all the necessary capabilities to save and schedule a calculation, but I only get a critical error telling me to contact support. See screenshot below. I used a simple time series with a constant value of 1 every 5 sec and wanted to see if I could get data points every second in a 20 sec period. The calculation I used was “Resample to granularity” 


We discussed and resolved that the issue is caused by lack of support in ‘Session API’ in our new CogIdP.

To address the issue:
 * please log in using legacy methods - aka choose “Other sign in methods” in login page.

Reply